

Synchronisation of Serbia’s GDP Cycle with Other Former Yugoslav Economies
4.1 Synchronisation in the cycle graphs
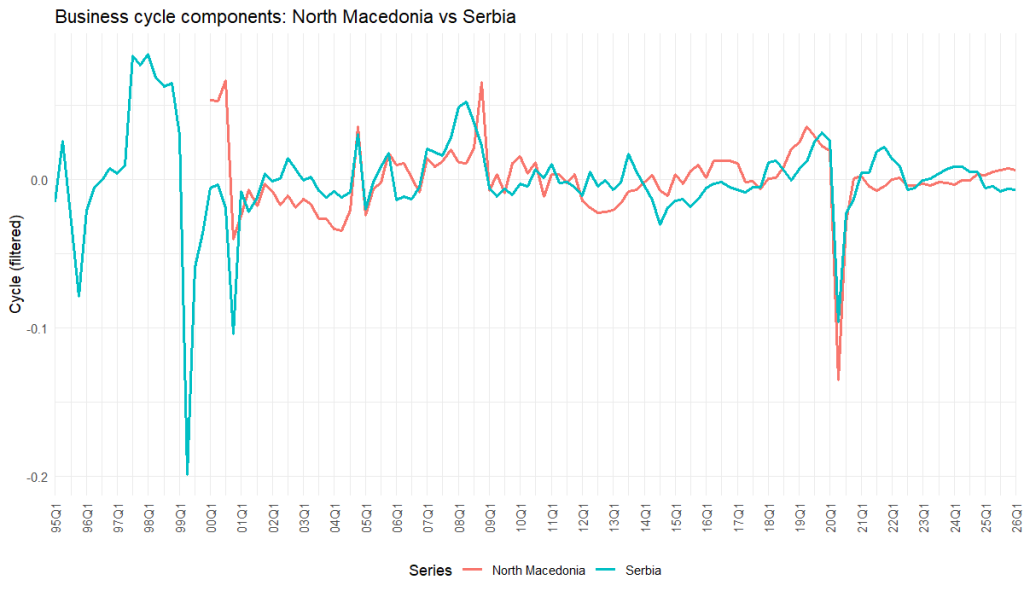
Part 4 asks whether Serbia’s GDP cycle moves together with the GDP cycles of Bosnia and Herzegovina, Croatia, Montenegro, North Macedonia and Slovenia. Synchronisation matters because economies that share cyclical phases may also share trade channels, financial linkages, labour-market exposure, remittance flows, external shocks or policy spillovers. In this analysis, synchronisation is examined using HP-filtered cycle graphs, cross-correlation functions and the concordance index.
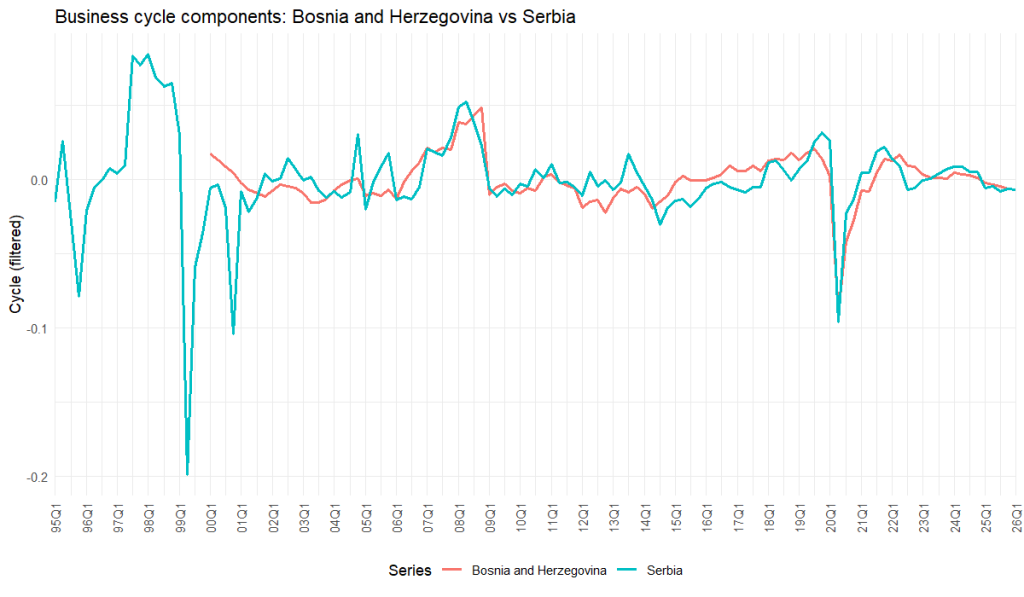
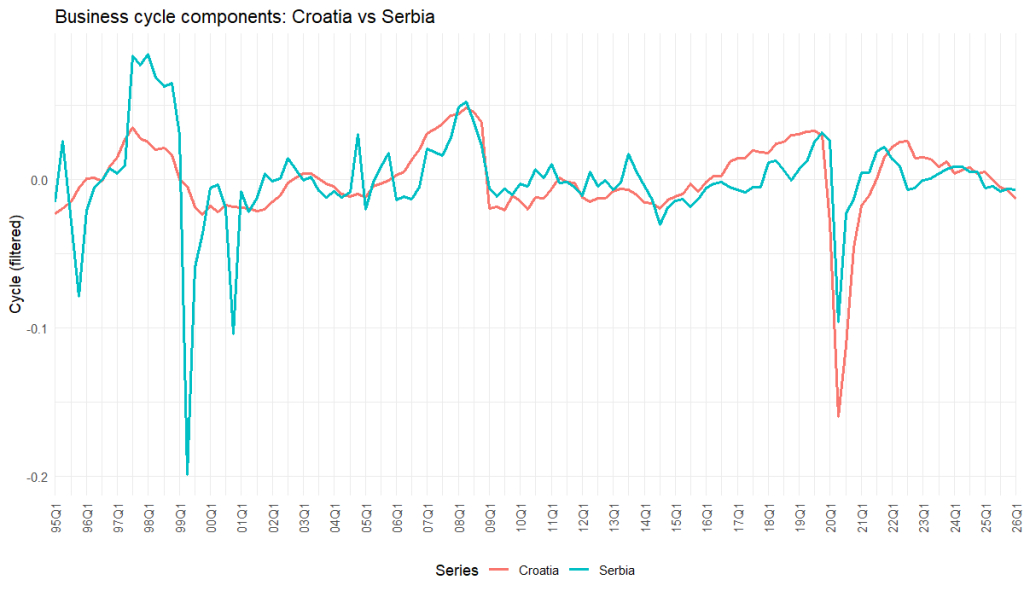
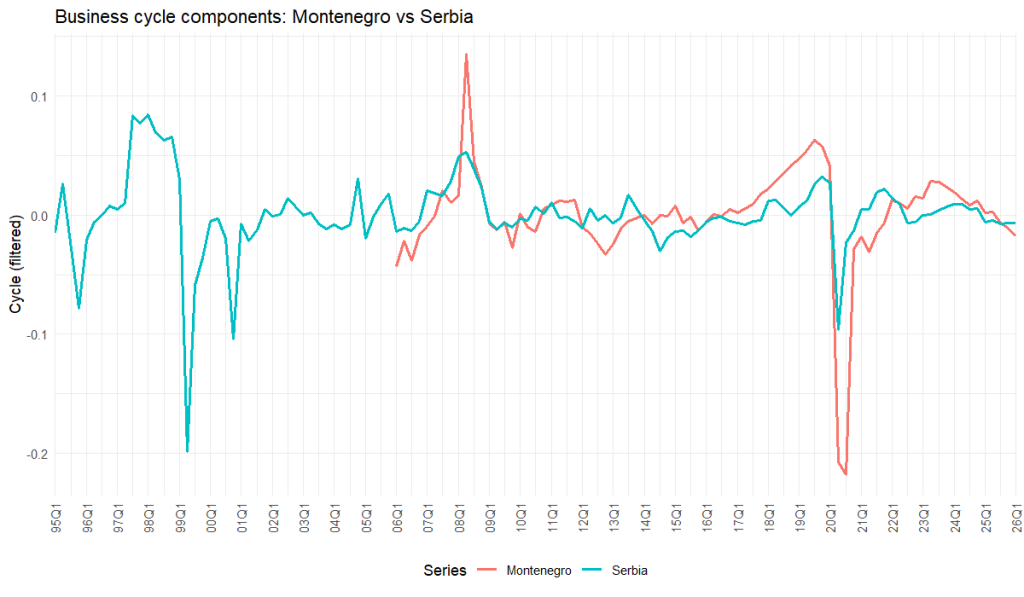
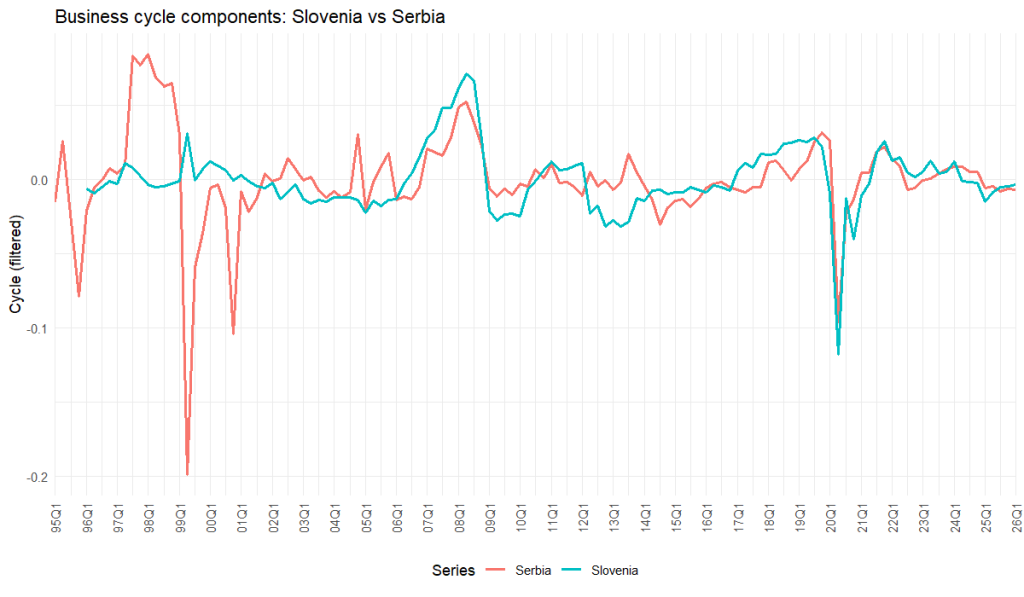
The strongest visual synchronisation is between Serbia and Bosnia and Herzegovina, Croatia and Montenegro. In all three cases, the major regional shocks are visible. The downturn around the global financial crisis and the COVID-19 contraction appear across the region. Serbia and Bosnia and Herzegovina show especially close movement in several parts of the sample, including the pandemic period. Serbia and Croatia also move together, although Croatia’s pandemic decline appears more pronounced. Serbia and Montenegro share the timing of several major episodes, but Montenegro’s cycle is visibly more volatile, especially around COVID-19, which is consistent with the structure of a smaller and more tourism-sensitive economy.
North Macedonia shows weaker and less stable visual synchronisation with Serbia. Some common episodes are visible, especially around the global financial crisis and COVID-19, but the overall alignment is less consistent. Slovenia also shares the major European and regional shocks, but its cycle appears smoother and less tightly linked to Serbia than the cycles of Bosnia and Herzegovina, Croatia and Montenegro. This is plausible given Slovenia’s earlier EU integration, higher income level and different production structure.
4.2 Cross-correlation functions and concordance
The cross-correlation functions support the visual interpretation. For Bosnia and Herzegovina, Croatia and Montenegro, the strongest correlations with Serbia are concentrated around lag zero, with significant neighbouring correlations at nearby lags. This suggests that these cycles mostly move contemporaneously. There may be short lead-lag effects of one or two quarters, but the dominant result is not that one economy systematically leads the other. Rather, common shocks and regional transmission mechanisms appear to move these economies together.
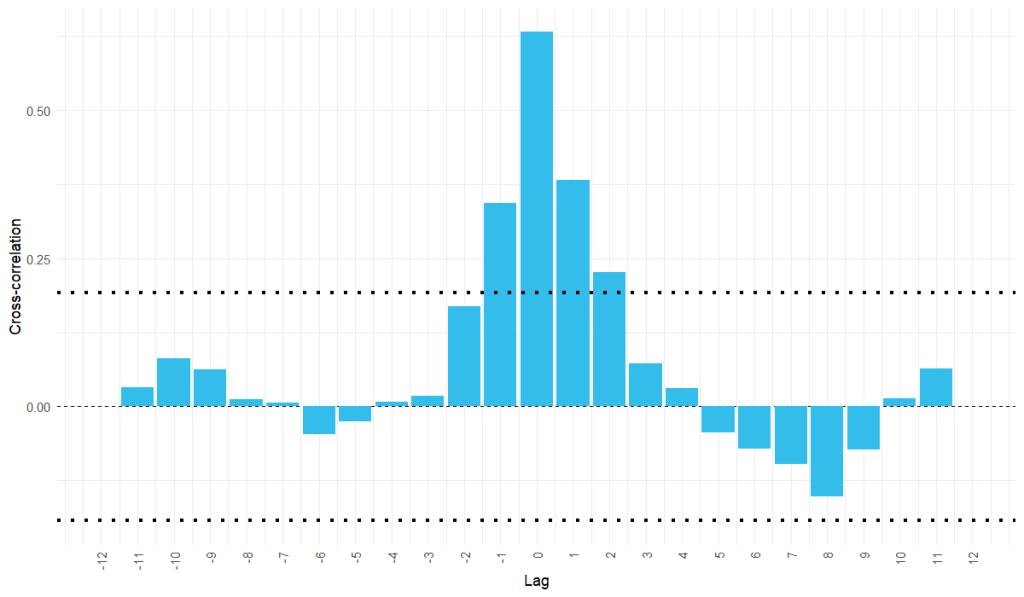
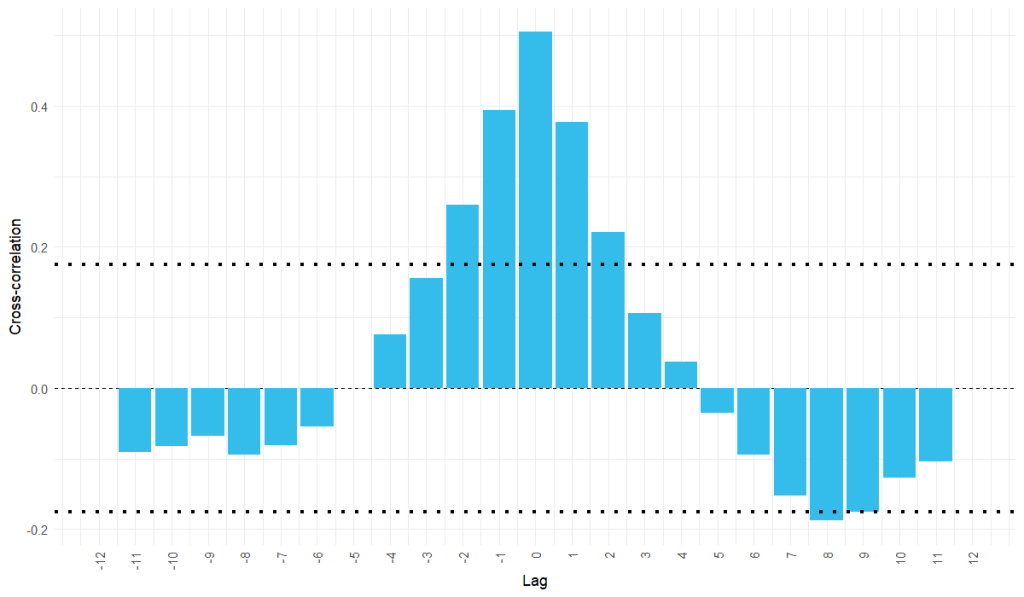
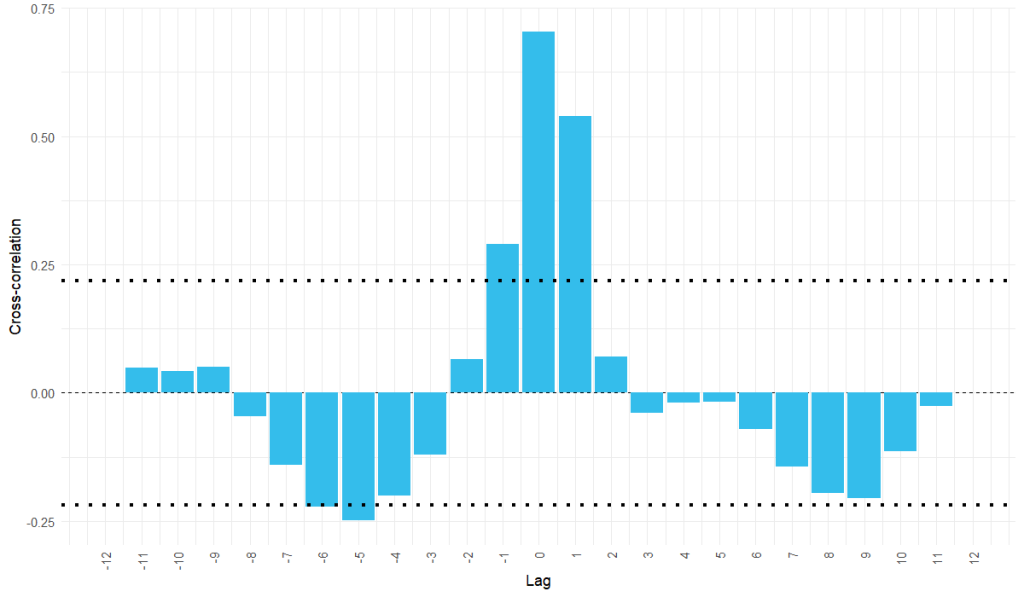
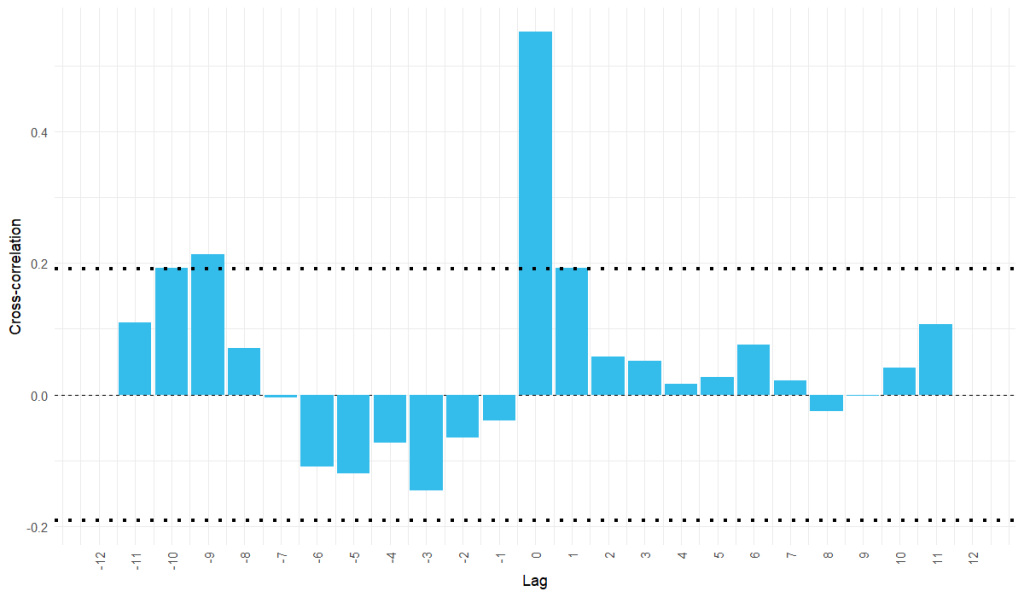
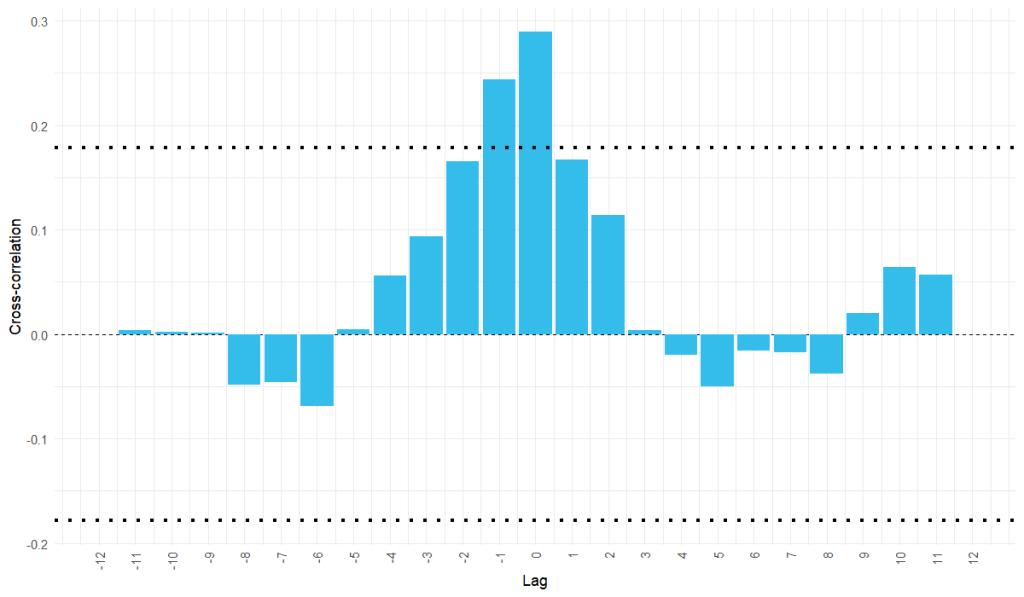
For North Macedonia, the cross-correlation function still shows some contemporaneous association, but the overall synchronisation is weaker. For Slovenia, the strongest association is also around lag zero, but it is less pronounced than for Bosnia and Herzegovina, Croatia and Montenegro. The pattern suggests that Slovenia shares some common European and regional shocks with Serbia, but its business cycle is not as tightly aligned with Serbia’s as those of the closer Western Balkan economies.
Table 5 gives the clearest summary. Serbia’s GDP cycle is most synchronised with Bosnia and Herzegovina, with a concordance index of about 0.702. Croatia follows closely, with about 0.696. Montenegro is also strongly aligned, with about 0.667. Slovenia shows moderate synchronisation, with about 0.628. North Macedonia is the weakest pair, with a concordance index of about 0.552 and a statistically insignificant p-value. These results are economically plausible. Serbia appears most synchronised with economies that share stronger regional linkages and exposure to similar shocks, while Slovenia and North Macedonia are less closely aligned for different structural reasons.
Table 5. Concordance index for all GDP-cycle pairs
| Series1 | Series2 | N | N11 | N00 | Nc | C_index | p_value |
|---|---|---|---|---|---|---|---|
| Croatia | Serbia | 125 | 38 | 49 | 87 | 0.696 | 0.000 |
| Slovenia | Serbia | 121 | 28 | 48 | 76 | 0.628 | 0.006 |
| Bosnia and Herzegovina | Serbia | 104 | 30 | 43 | 73 | 0.702 | 0.000 |
| Montenegro | Serbia | 81 | 25 | 29 | 54 | 0.667 | 0.004 |
| North Macedonia | Serbia | 105 | 24 | 34 | 58 | 0.552 | 0.329 |
The conclusion from Part 4 is therefore that Serbia is not cyclically isolated. Its GDP cycle is visibly and statistically connected to the region, especially to Bosnia and Herzegovina, Croatia and Montenegro. The regional cycle is not perfectly uniform, but the main shocks and recoveries are shared.
Methodological appendix to Part 4
The cross-correlation function compares two cyclical series at different leads and lags. If the highest correlation is at lag zero, the two cycles move most strongly at the same time. If the highest correlation appears at a positive or negative lag, one series may lead or lag the other. However, the sign of the lag must be interpreted according to the convention used in the software, so the safest substantive reading focuses on whether the main association is contemporaneous or clearly displaced.
The concordance index measures how often two economies are in the same cyclical phase. Each quarter is first classified as expansion or contraction for each economy. If both economies are in expansion, or both are in contraction, that quarter counts as concordant. The concordance index is the share of comparable quarters in which the two economies are in the same phase. A value of one means perfect phase alignment. A value close to one half suggests weak or no systematic alignment. In practice, concordance should be read together with graphs and cross-correlations, because two economies may be in the same phase without having cycles of the same amplitude.
Overall conclusion
Serbia’s quarterly GDP series from 1995Q1 to 2026Q1 is a strongly trending, highly persistent and visibly seasonal macroeconomic series. The time-series features confirm what the graphs show: the series needs seasonal adjustment, log transformation and differencing before short-term modelling. The ARIMA model performs well as a near-term forecasting tool, with holdout observations falling inside the prediction intervals and with accuracy stronger than simple benchmark models. Business-cycle dating using HP, Baxter-King and Corbae-Ouliaris filters identifies the same major historical episodes, although the exact timing of turning points differs across methods. Finally, Serbia’s GDP cycle is most synchronised with Bosnia and Herzegovina, Croatia and Montenegro, moderately synchronised with Slovenia and weakest in relation to North Macedonia.
The broader message is that Serbia’s GDP should be read simultaneously as a national time series and as part of a regional macroeconomic system. Domestic shocks matter, but the main cyclical episodes are also regional. For analysts, this means that monitoring Serbia alone is useful, but monitoring Serbia together with its former Yugoslav neighbours gives a richer understanding of the cycle.
References
Baxter, M., & King, R. G. (1999). Measuring business cycles: Approximate band-pass filters for economic time series. Review of Economics and Statistics, 81(4), 575–593.
Corbae, D., & Ouliaris, S. (2006). Extracting cycles from nonstationary data. Econometric Theory, 22(4), 843–858.
Eurostat. (n.d.). Gross domestic product and main components — quarterly national accounts (namq_10_gdp).
Harding, D., & Pagan, A. (2002). Dissecting the cycle: A methodological investigation. Journal of Monetary Economics, 49(2), 365–381.
Hodrick, R. J., & Prescott, E. C. (1997). Postwar U.S. business cycles: An empirical investigation. Journal of Money, Credit and Banking, 29(1), 1–16.
Hyndman, R. J., & Athanasopoulos, G. (2025). Forecasting: Principles and Practice.
U.S. Census Bureau. (2025). X-13ARIMA-SEATS Seasonal Adjustment Program.
