Synchronisation of Slovenia’s GDP cycle with other former Yugoslav economies
Part 4 compares Slovenia’s GDP cycle with the cycles of Bosnia and Herzegovina, Croatia, Montenegro, North Macedonia and Serbia. Synchronisation matters because economies that move together may share trade exposure, financial channels, labour-market links, EU demand conditions, tourism shocks or regional spillovers. The analysis uses HP-filtered cycles, cross-correlation functions and the concordance index. Table 5 is used for lead-lag interpretation, but it is not inserted as a displayed blog table.
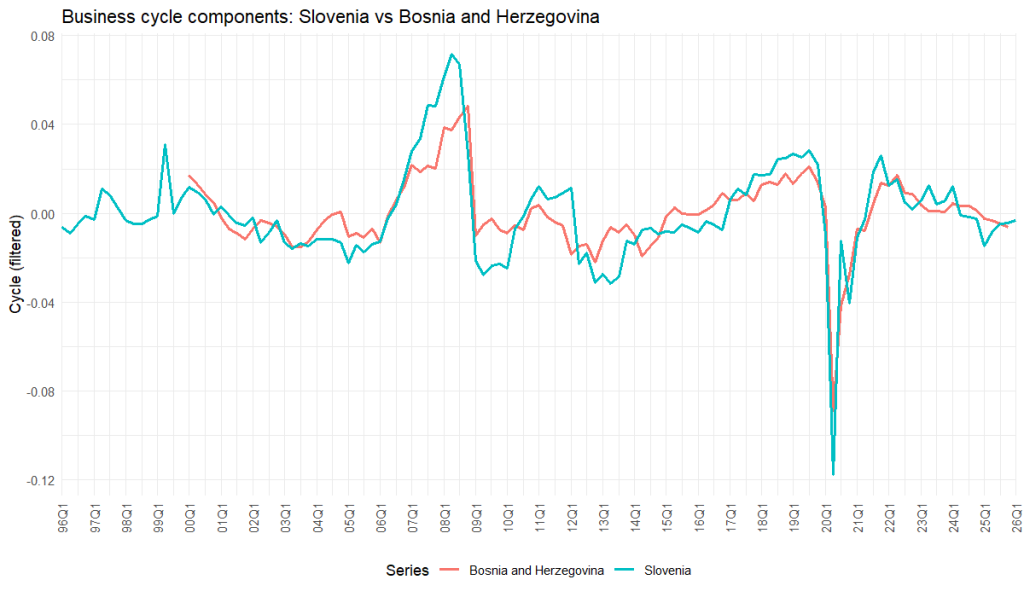
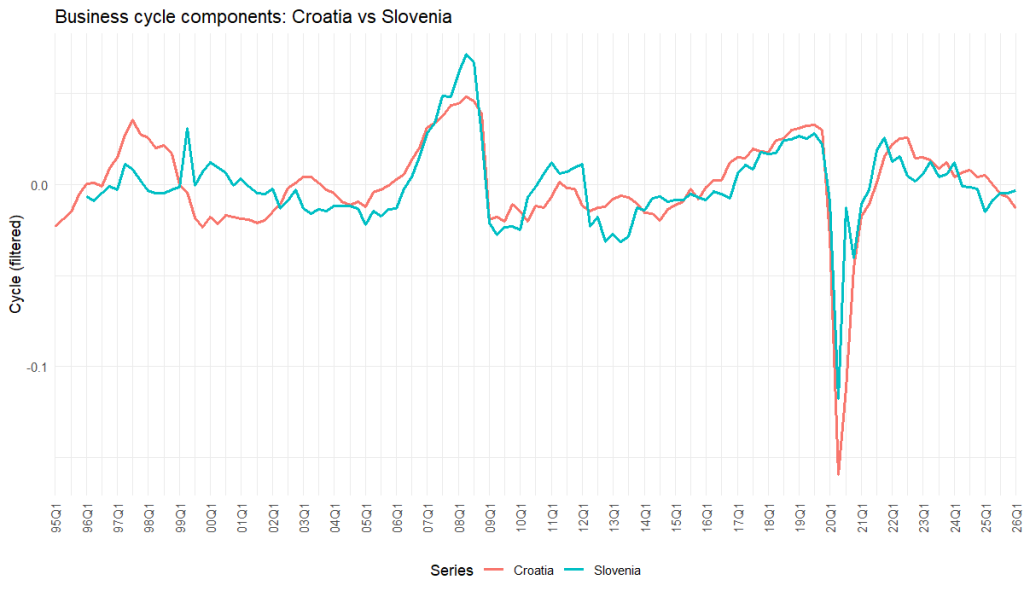
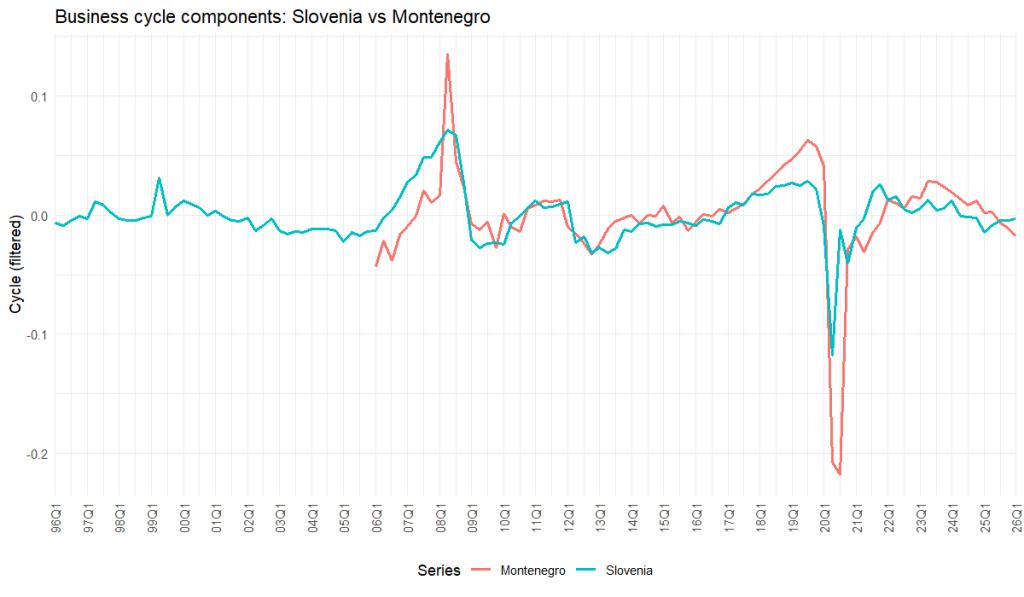
The visual evidence shows that Slovenia shares major cyclical episodes with the region, but the strength of synchronisation varies. The strongest visual alignment is with Bosnia and Herzegovina, Croatia and Montenegro. With Bosnia and Herzegovina, the global financial crisis, the recovery phase, the COVID-19 contraction and the post-pandemic rebound are closely aligned. With Croatia, the common European cycle is clear: pre-crisis expansion, crisis contraction, later recovery, pandemic shock and rebound. With Montenegro, the timing of major shocks is shared, although Montenegro’s cycle has much larger amplitude.
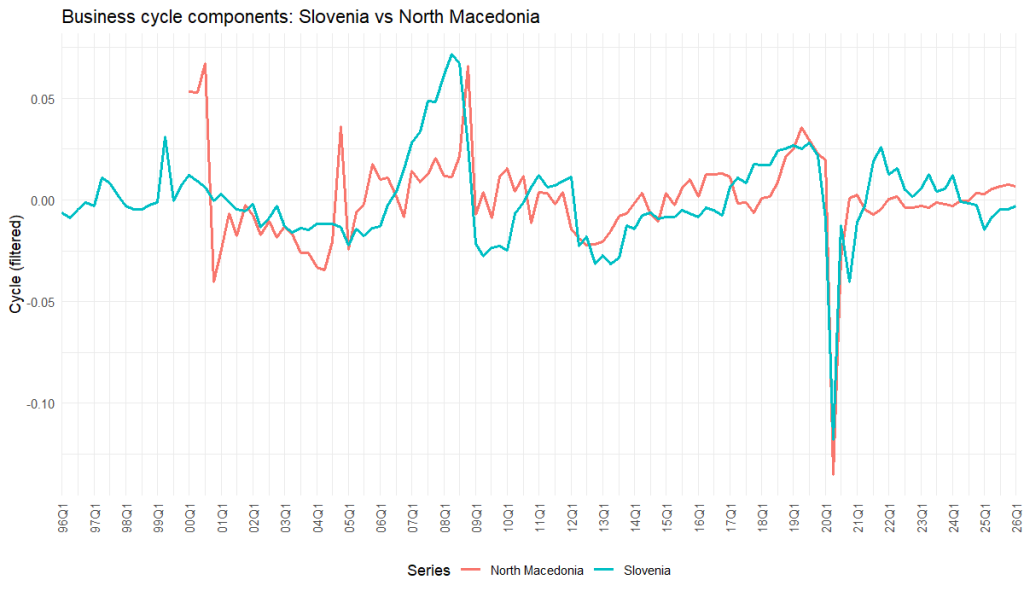
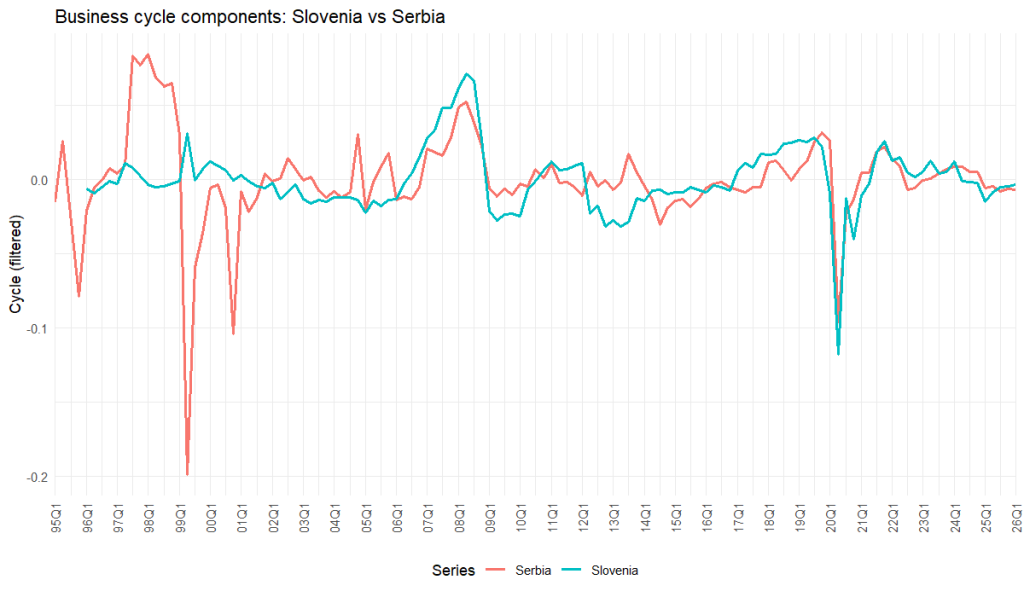
The relationship with North Macedonia is more moderate. Shared shocks are visible, especially around COVID-19, but the broader sequence of expansions and contractions is less closely aligned. The relationship with Serbia is weaker still. Serbia and Slovenia share the pandemic shock and some broad regional movements, but the cycle graphs suggest less consistent phase alignment than in the Bosnia and Herzegovina, Croatia and Montenegro comparisons.
The cross-correlation results confirm this hierarchy. Using the file-order convention, negative lags are interpreted as the first-named series leading the second, while positive lags suggest the second-named series leading the first. For Slovenia and Bosnia and Herzegovina, the zero-lag correlation is very high, about 0.879. Lag -1 is also high, about 0.714. Since Slovenia is listed first, this suggests that Slovenia may lead Bosnia and Herzegovina slightly in some phases, but the dominant relationship is contemporaneous.
For Croatia and Slovenia, the zero-lag correlation is about 0.758. The lag +1 correlation is also high, about 0.623, while lag -1 is about 0.535. Since Croatia is listed first in the file name, the positive-lag shoulder suggests that Slovenia may lead Croatia by one quarter in some episodes, although the strongest relationship remains at lag zero. For Slovenia and Montenegro, the highest correlation is at lag -1, about 0.674, while the zero-lag correlation is almost as high, about 0.666. Since Slovenia is listed first, this points to a possible one-quarter Slovenian lead over Montenegro, but the difference from contemporaneous correlation is small.
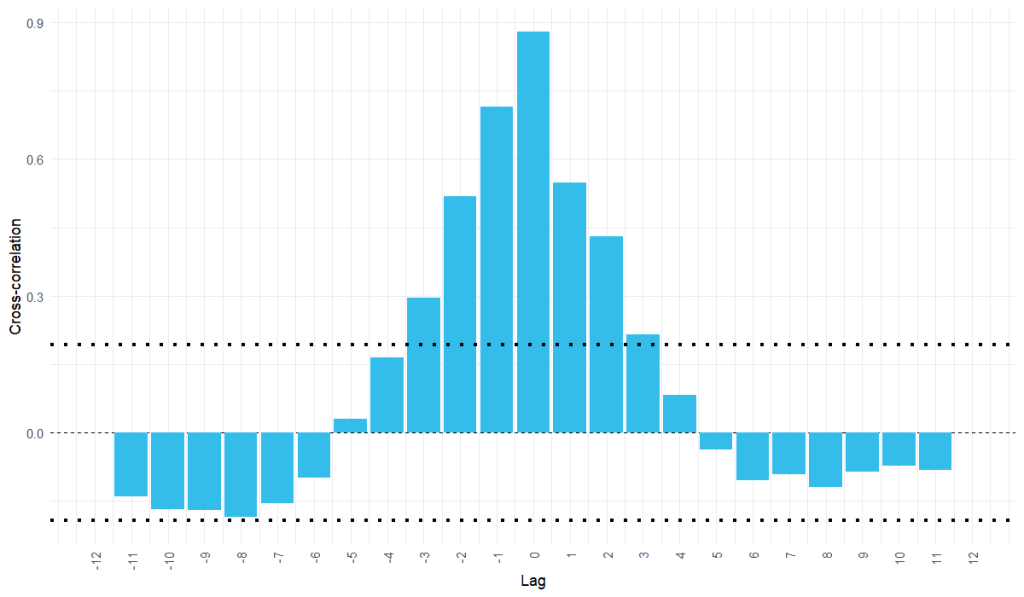
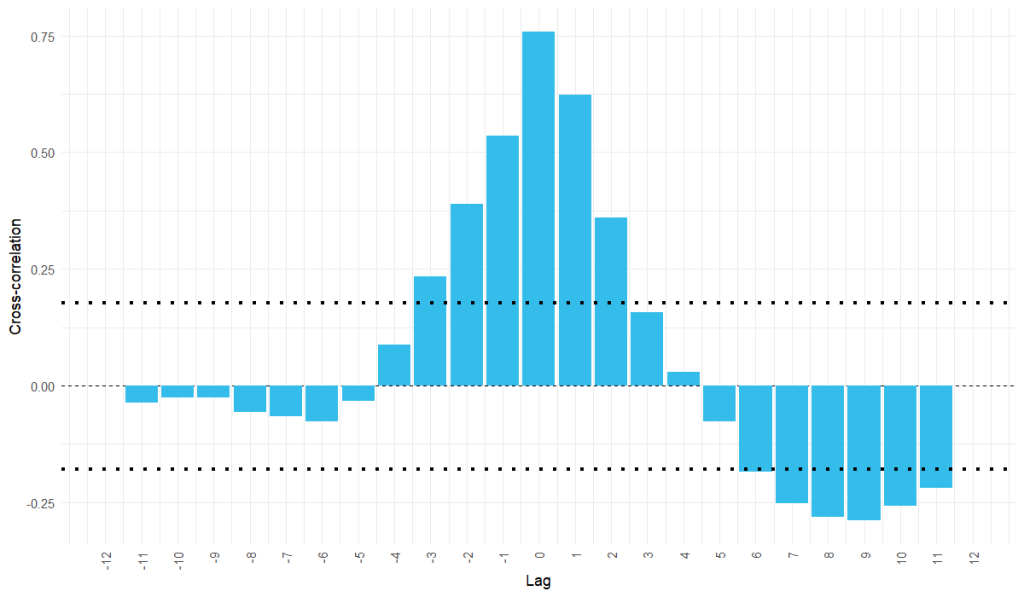
For Slovenia and North Macedonia, the zero-lag correlation is about 0.582, with lag -1 at about 0.385. This is a moderate relationship, with some suggestion that Slovenia may lead North Macedonia in certain phases. For Slovenia and Serbia, the zero-lag correlation is only about 0.289, with lag -1 at about 0.243. This is clearly the weakest cross-correlation relationship among the reported Slovenia pairs.
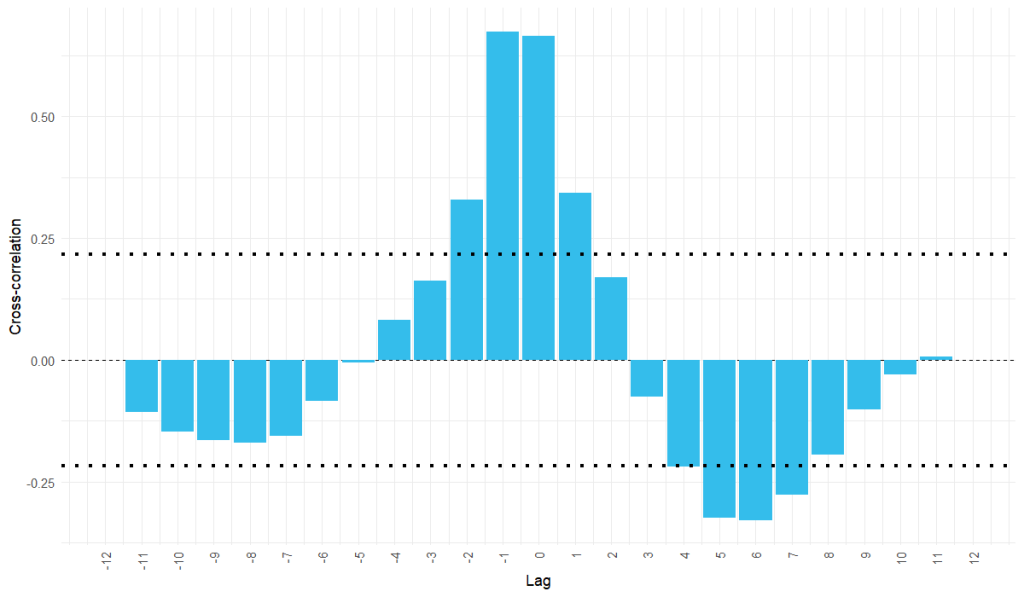
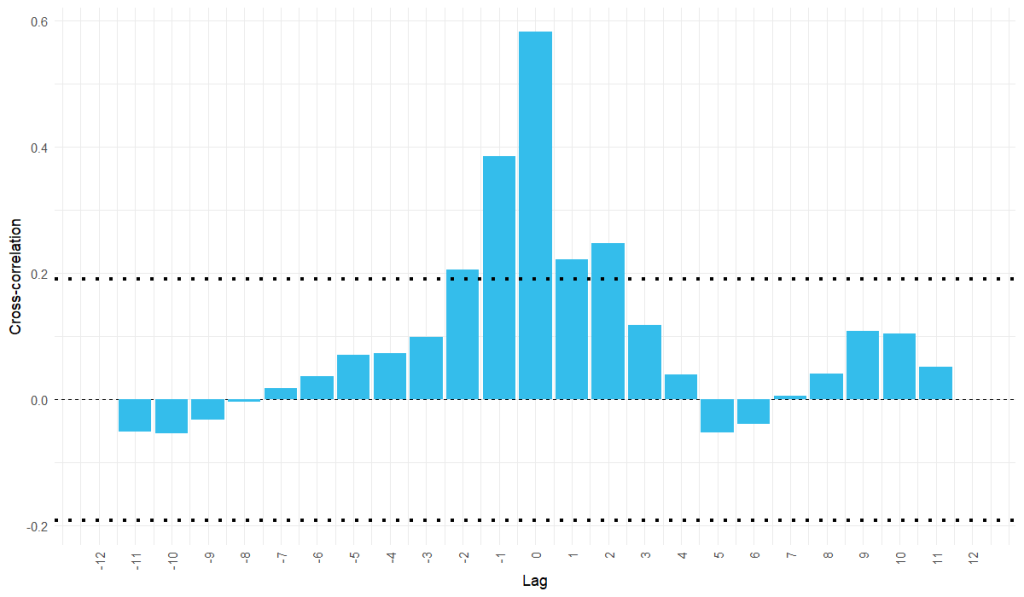
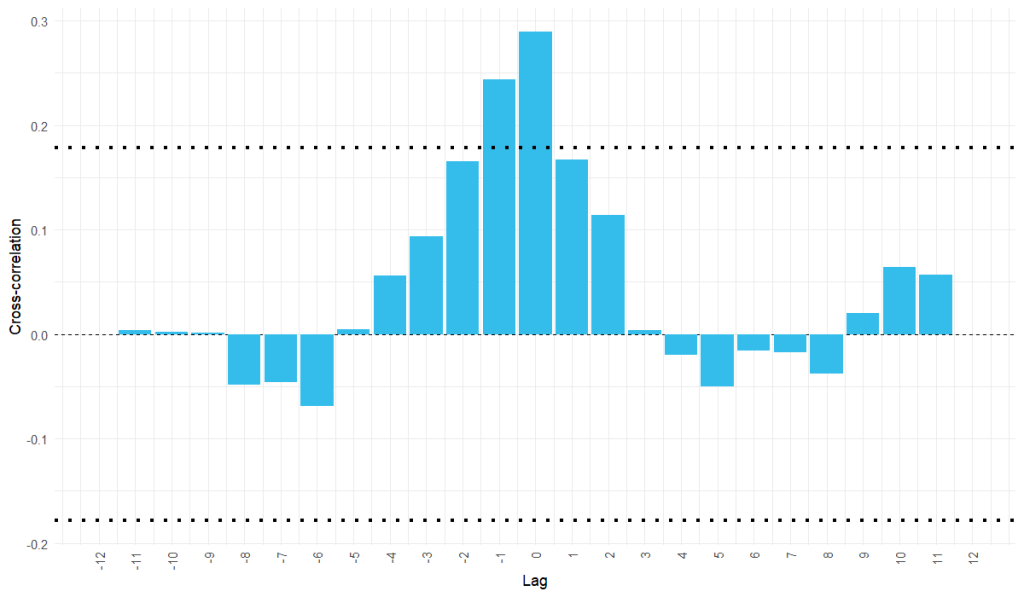
Table 6 gives the phase-based summary. Slovenia’s highest concordance is with Bosnia and Herzegovina, at about 0.856. Montenegro follows at about 0.790. Croatia is also strongly synchronised, with a concordance index of about 0.719. Serbia is moderately synchronised, at about 0.628. North Macedonia is weaker, at about 0.590, and its p-value is not conventionally significant. This ranking is economically plausible. Slovenia’s cycle is strongly connected to the region, but its closest synchronisation in this exercise is with Bosnia and Herzegovina, Montenegro and Croatia. The links with Serbia and North Macedonia are weaker.
Table 6. Concordance index
The conclusion from Part 4 is that Slovenia is both regionally connected and structurally distinct. It shares major shocks with other former Yugoslav economies, but its cycle often appears smoother and more closely tied to the broader European cycle. Synchronisation is strongest with Bosnia and Herzegovina, Montenegro and Croatia, weaker with Serbia and weakest with North Macedonia. The lead-lag evidence suggests that Slovenia may sometimes move slightly ahead of some regional partners, but the main result is still contemporaneous movement around major shocks.
Methodological appendix to Part 4
The cross-correlation function measures the relationship between two cyclical series at different leads and lags. A peak at lag zero means that the two cycles move most strongly at the same time. A peak away from zero may suggest that one economy leads or lags the other. The sign of the lag must be interpreted according to the order of the series in the calculation.
The concordance index measures how often two economies are in the same cyclical phase. Each quarter is classified as expansion or contraction for each economy. If both economies are in expansion, or both are in contraction, the quarter is concordant. The index is the share of comparable quarters in which the phases match. A value close to one indicates strong synchronisation, while a value close to one half suggests weak phase alignment. Concordance should be read together with the cycle graphs and cross-correlations, because two economies may share shocks while still having different phase timing or amplitude.
Overall conclusion
Slovenia’s quarterly GDP series from 1996Q1 to 2026Q1 is strongly trending, highly persistent and seasonally structured. The time-series features show very high trend strength, meaningful seasonality, strong autocorrelation and non-stationarity in levels. The ARIMA model performs well as a short-term forecasting tool: it passes residual checks, outperforms the reported benchmark models and keeps all holdout observations inside the forecast intervals. Business-cycle dating identifies the pre-2008 expansion, the global-financial-crisis contraction, the early-2010s adjustment period, the post-2013 recovery, the COVID-19 shock and the post-pandemic rebound. The latest cyclical position is less clear and depends on the filter used. Regional synchronisation is strongest with Bosnia and Herzegovina, Montenegro and Croatia, moderate with Serbia and weakest with North Macedonia.
The broader message is that Slovenia’s GDP cycle should be read both as a national high-income European cycle and as part of the former Yugoslav regional macroeconomic space. Slovenia shares the region’s major shocks, but its cycle is smoother and may sometimes move slightly ahead of less advanced or more volatile neighbours.
References
Baxter, M., & King, R. G. (1999). Measuring business cycles: Approximate band-pass filters for economic time series. Review of Economics and Statistics, 81(4), 575–593.
Corbae, D., & Ouliaris, S. (2006). Extracting cycles from nonstationary data. Econometric Theory, 22(4), 843–858.
Eurostat. (n.d.). Gross domestic product and main components — quarterly national accounts (namq_10_gdp).
Harding, D., & Pagan, A. (2002). Dissecting the cycle: A methodological investigation. Journal of Monetary Economics, 49(2), 365–381.
Hodrick, R. J., & Prescott, E. C. (1997). Postwar U.S. business cycles: An empirical investigation. Journal of Money, Credit and Banking, 29(1), 1–16.
Hyndman, R. J., & Athanasopoulos, G. (2025). Forecasting: Principles and Practice.
U.S. Census Bureau. (2025). X-13ARIMA-SEATS Seasonal Adjustment Program.