
Dating Serbia’s Business Cycle
3.1 Why cycle dating matters
Part 3 moves from forecasting the level of GDP to identifying the business cycle. The business cycle is the movement of economic activity around its longer-term trend. An economy can still be growing in level terms while being below its trend, and it can be above trend even if growth is slowing. For this reason, cycle dating based on filtered GDP is different from the popular rule that a recession occurs after two consecutive quarters of negative growth.
This analysis uses three filters: Hodrick-Prescott, Baxter-King and Corbae-Ouliaris. Each filter separates the trend and cyclical components differently. The goal is not to find a single perfect cycle, because no such statistical object exists. The goal is to see whether different methods tell a broadly consistent story.
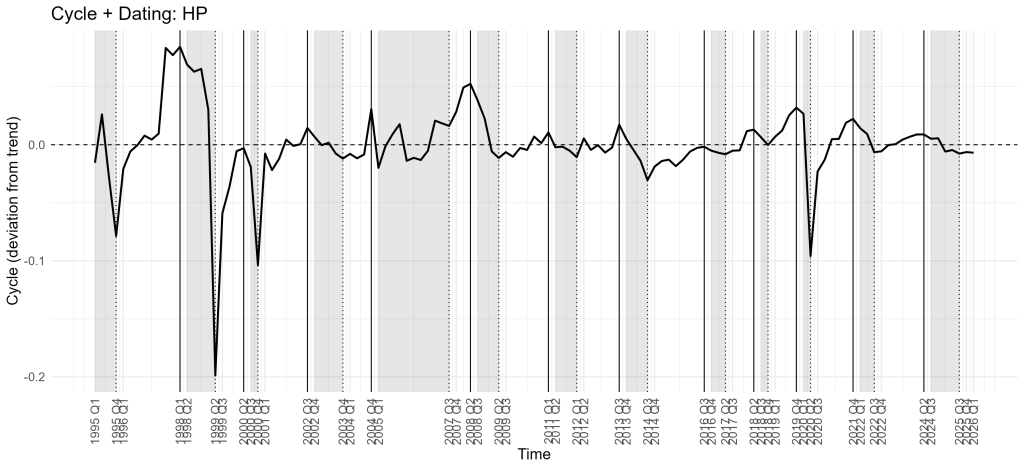
The Hodrick-Prescott filter gives a long and easily interpretable view of the cycle across the full sample. Figures 6 and 7 show the deep negative episode around 1999, a strong pre-2008 expansion, the downturn associated with the global financial crisis, a weaker and more uneven post-crisis period, the COVID-19 contraction and the subsequent recovery. According to Table 4, the HP filter classifies Serbia as being in expansion for 71 quarters and in contraction for 54 quarters. In the latest part of the sample, it identifies expansion through 2024Q2, contraction from 2024Q3 to 2025Q3 and renewed expansion in 2025Q4–2026Q1.

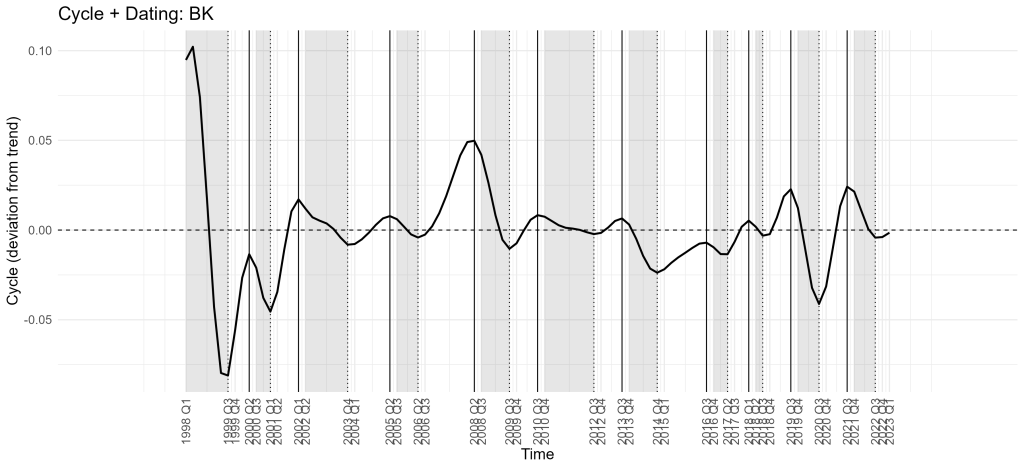
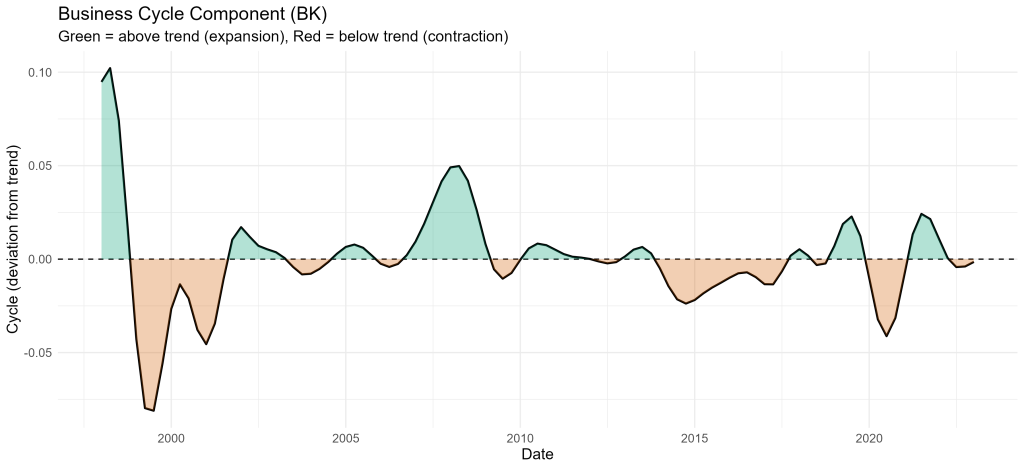
The Baxter-King filter gives a smoother but shorter effective sample because it loses observations at the beginning and end of the period. This is a normal consequence of its band-pass construction. Figures 8 and 9 show that the Baxter-King filter captures the main episodes: the late-1990s contraction, pre-2008 expansion, global-financial-crisis contraction, weaker cycles in the early 2010s, the pandemic decline and the post-pandemic recovery. It is less sensitive to very short fluctuations, which can be an advantage when the aim is to identify medium-term business-cycle movements. Its disadvantage is that it is less informative at the sample endpoints.
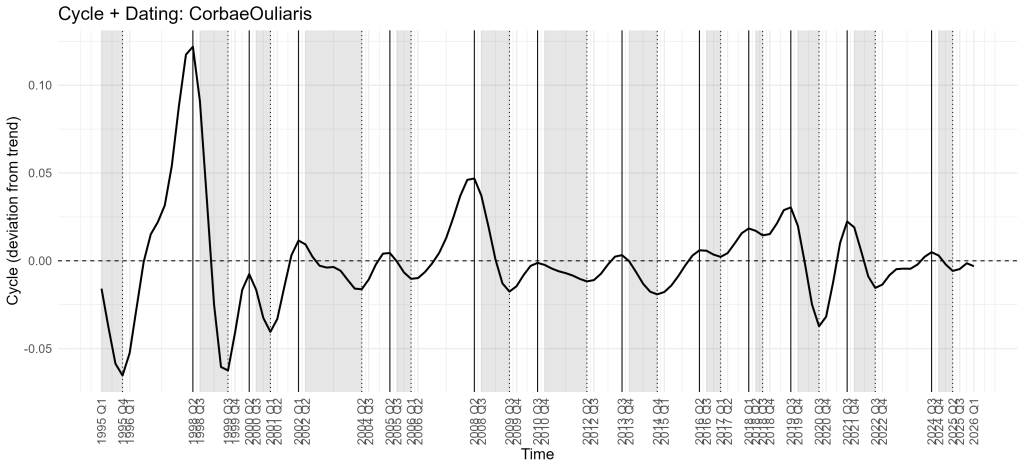
The Corbae-Ouliaris filter gives a result that in several episodes lies between the HP and Baxter-King classifications. It keeps the full sample and identifies many of the same turning points. Around COVID-19, it identifies contraction from 2019Q4 to 2020Q3 and expansion from 2020Q4 to 2021Q3. In the latest observations, it identifies expansion from 2022Q4 to 2024Q3, contraction from 2024Q4 to 2025Q2 and renewed expansion from 2025Q3 to 2026Q1. This is close to, but not identical with, the HP dating.
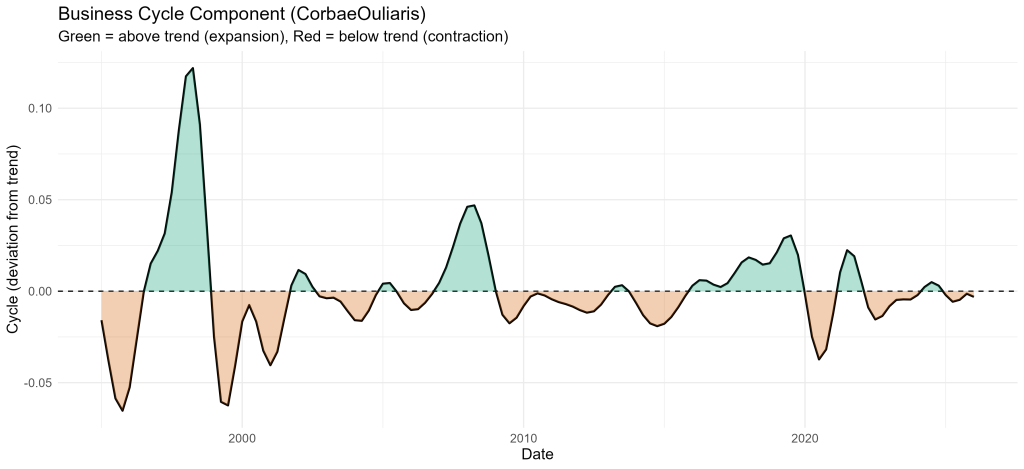
Which filter should be preferred? For a macroeconomic blog post, the HP filter is the most convenient main reference because it is intuitive, covers the full sample and aligns well with visible economic events. However, it should not be used mechanically. The HP filter can be sensitive at the endpoints and may sometimes classify short movements too sharply. Baxter-King and Corbae-Ouliaris are therefore valuable robustness checks. Where all three filters agree, the evidence for a cyclical phase is strong. Where they differ by one or two quarters, it is better to speak of a turning-point zone rather than a precise turning-point date.
Table 4. Cycles dating for Serbia
The robust empirical story is clear. Serbia’s GDP cycle contains an exceptional negative episode in 1999, a strong upswing before the global financial crisis, a major downturn in 2008–2009, a less dynamic post-crisis phase, a sharp but short pandemic contraction and a recovery that returned GDP above trend before the latest moderation.
Methodological appendix to Part 3
Business-cycle dating in this analysis is based on extracting a trend from the seasonally adjusted GDP series and then interpreting the deviation from that trend as the cyclical component. When the cycle is above zero, GDP is above its estimated trend and the economy is classified as being in expansion. When the cycle is below zero, GDP is below its estimated trend and the economy is classified as being in contraction.
The Hodrick-Prescott filter estimates a smooth trend and treats deviations from that trend as the cycle. The Baxter-King filter is a band-pass filter designed to isolate movements at business-cycle frequencies. The Corbae-Ouliaris filter is another method for extracting cyclical movements from non-stationary data. The key point is that filters are not neutral measuring devices. They impose assumptions about what counts as trend and what counts as cycle. For this reason, the most reliable interpretation comes from comparing filters and focusing on common signals rather than isolated method-specific turning points.