
ARIMA estimation and short-term forecasting
Part 2 moves from description to forecasting. Since Part 1 showed that Croatia’s GDP is persistent, seasonal and non-stationary in levels, the natural next question is whether a statistical model can use that structure to forecast the near future. The model used here is an ARIMA model estimated on the log-transformed series and evaluated over an eight-quarter holdout period. This is not a structural macroeconomic model. It does not forecast GDP through consumption, investment, exports, tourism or fiscal policy. Instead, it asks whether the past behaviour of the series itself contains enough information for short-term projection.
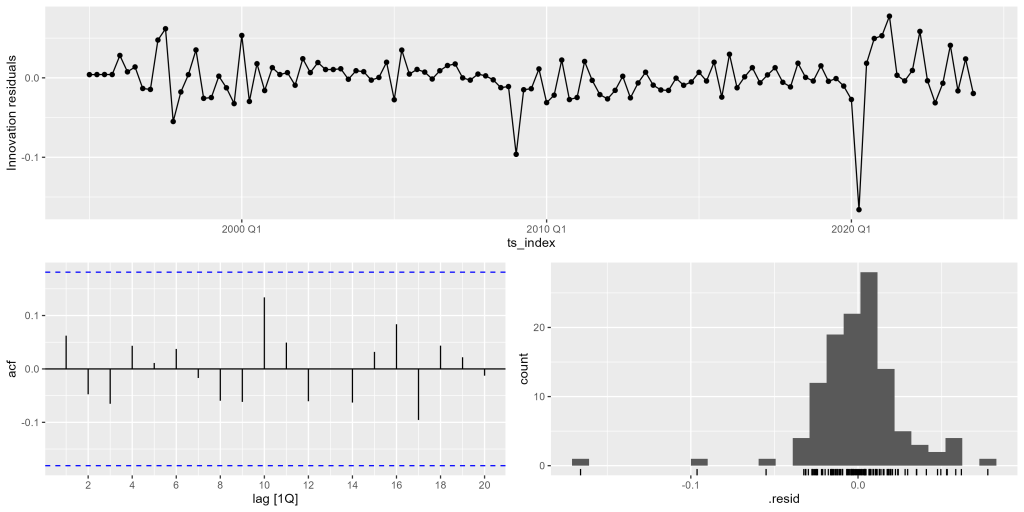
Table 2 reports an ARIMA model with an autoregressive coefficient of about 0.820, a seasonal moving-average coefficient of about -0.405 and a positive constant of about 0.0044. All three parameters are statistically significant. The autoregressive coefficient confirms that Croatia’s GDP has strong inertia. Shocks to the GDP path do not disappear immediately; they carry forward into subsequent quarters, although gradually diminishing. This is consistent with the persistence already visible in the autocorrelation function.
Table 2. ARIMA model estimation and parameters accuracy
| Model | arima | ets | naive | snaive |
|---|---|---|---|---|
| sigma2 | 0.001 | 0.000 | 0.015 | 0.002 |
| log_lik | 241.295 | 136.235 | NA | NA |
| AIC | -474.589 | -254.469 | NA | NA |
| AICc | -474.219 | -252.787 | NA | NA |
| BIC | -463.680 | -229.610 | NA | NA |
| MSE | NA | 0.001 | NA | NA |
| AMSE | NA | 0.001 | NA | NA |
| MAE.x | NA | 0.004 | NA | NA |
| lb_stat | 2.172 | 15.355 | 404.065 | 94.780 |
| lb_pvalue | 0.825 | 0.009 | 0.000 | 0.000 |
| .type | Test | Test | Test | Test |
| ME | 0.019 | 0.023 | 0.178 | 0.052 |
| RMSE | 0.021 | 0.026 | 0.202 | 0.055 |
| MAE.y | 0.019 | 0.023 | 0.178 | 0.052 |
| MPE | 0.380 | 0.471 | 3.604 | 1.068 |
| MAPE | 0.380 | 0.471 | 3.604 | 1.068 |
| ACF1 | -0.694 | -0.597 | -0.015 | 0.447 |
| estimate__ar1 | 0.820 | NA | NA | NA |
| std.error__ar1 | 0.059 | NA | NA | NA |
| statistic__ar1 | 13.999 | NA | NA | NA |
| p.value__ar1 | 0.000 | NA | NA | NA |
| estimate__sma1 | -0.405 | NA | NA | NA |
| std.error__sma1 | 0.116 | NA | NA | NA |
| statistic__sma1 | -3.477 | NA | NA | NA |
| p.value__sma1 | 0.001 | NA | NA | NA |
| estimate__constant | 0.004 | NA | NA | NA |
| std.error__constant | 0.002 | NA | NA | NA |
| statistic__constant | 2.799 | NA | NA | NA |
| p.value__constant | 0.006 | NA | NA | NA |
The negative seasonal moving-average coefficient is also important. It suggests that seasonal innovations are corrected over time, which is plausible for a series with such strong quarterly seasonality. The positive constant is consistent with an underlying growth tendency in the transformed series. In economic terms, the model captures persistence, seasonal correction and a modest positive drift.
The residual diagnostics are good. The Ljung-Box p-value for the ARIMA model is about 0.825, which means that there is no evidence of serious remaining residual autocorrelation. Figure 4 supports this conclusion. Most residuals fluctuate around zero, although the pandemic shock appears as a very large negative residual. This is not a weakness of the model in the ordinary sense. No univariate ARIMA model can anticipate a sudden pandemic collapse from the internal dynamics of the series alone. What matters is whether the model captures the normal structure of the series outside such exceptional shocks, and the residual diagnostics suggest that it largely does.
The ARIMA model also performs better than the benchmark alternatives. Its MAPE over the holdout period is about 0.380%, which is lower than the ETS model, the naive model and the seasonal naive model. Its RMSE and MAE are also lower than those of the benchmark models. This is important because a forecasting model should not merely fit the past. It should also outperform simple alternatives such as using the last observed value or the same quarter from the previous year. In this case, ARIMA provides the more useful short-term benchmark.
Figure 5 and Table 3 show the eight-quarter forecast from 2024Q2 to 2026Q1. The forecast preserves Croatia’s strong seasonal pattern, with high third-quarter values and lower first-quarter values. This is important because a model that ignored seasonality would be unsuitable for Croatia’s GDP series. All actual holdout observations fall within both the 80% and 95% prediction intervals. That means the model’s uncertainty bands are wide enough to contain the realised path while remaining analytically informative.
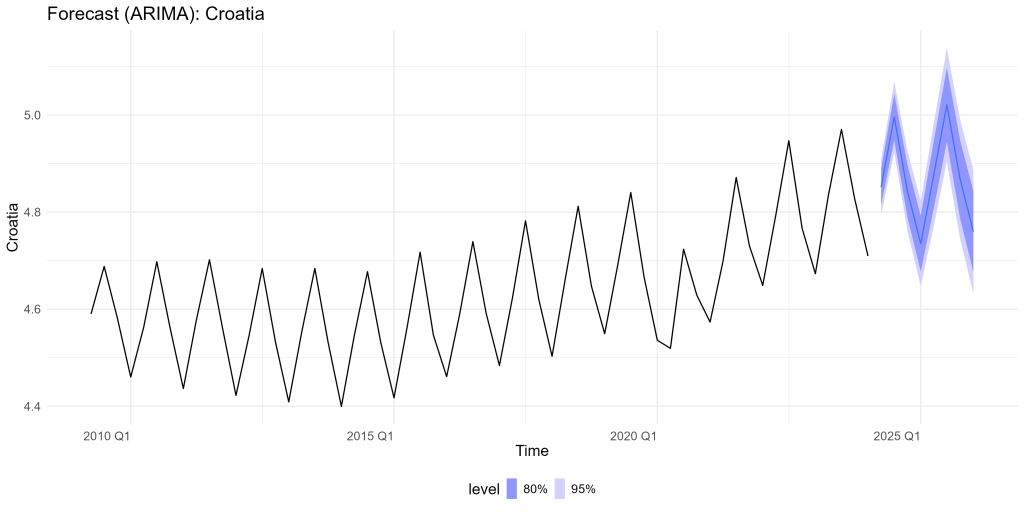
The point forecasts are generally close to the actual values. In 2024Q3, the actual GDP index is 149.835 and the forecast mean is 147.822. In 2024Q4, the actual value is 129.552 and the forecast mean is 126.821. In 2025Q3, the actual value is 153.690 and the forecast mean is 151.567. The model tends to underpredict the strongest seasonal peaks and some later observations, especially in 2025Q2 and 2025Q4, but the errors remain within the forecast bands. This is a useful pattern for interpretation: the model is capturing the seasonal structure and broad level, but the realised economy is somewhat stronger than the central forecast in several quarters.
Table 3. Forecast eight quarters ahead — ARIMA model
| Date | Actual | Mean | Lower 80% | Upper 80% | Lower 95% | Upper 95% |
|---|---|---|---|---|---|---|
| 2024 Q2 | 130.4 | 127.9 | 123.3 | 132.8 | 120.9 | 135.4 |
| 2024 Q3 | 149.8 | 147.8 | 140.9 | 155.1 | 137.4 | 159.0 |
| 2024 Q4 | 129.6 | 126.8 | 120.2 | 133.8 | 116.8 | 137.7 |
| 2025 Q1 | 115.0 | 113.8 | 107.5 | 120.6 | 104.2 | 124.3 |
| 2025 Q2 | 135.3 | 131.2 | 122.4 | 140.6 | 118.0 | 145.9 |
| 2025 Q3 | 153.7 | 151.6 | 140.4 | 163.6 | 134.9 | 170.3 |
| 2025 Q4 | 134.5 | 130.0 | 120.0 | 140.9 | 115.0 | 147.1 |
| 2026 Q1 | 117.4 | 116.7 | 107.4 | 126.8 | 102.7 | 132.5 |
The practical conclusion is that ARIMA is a credible short-term monitoring tool for Croatia’s GDP. It gives a disciplined baseline against which new releases can be compared. If actual GDP begins to move outside the prediction intervals, that would indicate a new shock or a structural change not captured by the recent statistical pattern. However, the model should not be used as a complete macroeconomic forecast. Croatia’s GDP is exposed to tourism demand, EU conditions, energy prices, policy changes and external shocks. A univariate ARIMA model can absorb such developments only after they appear in the data.
Methodological appendix to Part 2
ARIMA stands for autoregressive integrated moving average. The autoregressive part means that current values depend partly on past values. The integrated part means that differencing is used to handle non-stationarity. The moving-average part means that current values also depend on past shocks or forecast errors. Seasonal ARIMA models extend this logic to regular quarterly or monthly patterns. In this exercise, the series is split into a training sample and an eight-quarter holdout sample. The model is estimated on the training data and evaluated on observations not used in estimation. Forecast accuracy is assessed using RMSE, MAE and MAPE. RMSE penalises larger errors more heavily, MAE measures average absolute error and MAPE expresses error as a percentage of the observed value. Residual diagnostics, especially the Ljung-Box test, check whether the model has left systematic autocorrelation unexplained.