
Synchronisation of Montenegro’s GDP cycle with other former Yugoslav economies
Part 4 compares Montenegro’s GDP cycle with the cycles of Bosnia and Herzegovina, Croatia, North Macedonia, Serbia and Slovenia. Synchronisation matters because economies that move together may share trade exposure, tourism shocks, labour-market links, financial channels, external demand conditions or regional spillovers. The analysis uses HP-filtered cycles, cross-correlation functions and the concordance index. Table 5 is used for lead-lag interpretation, but it is not inserted as a displayed blog table.

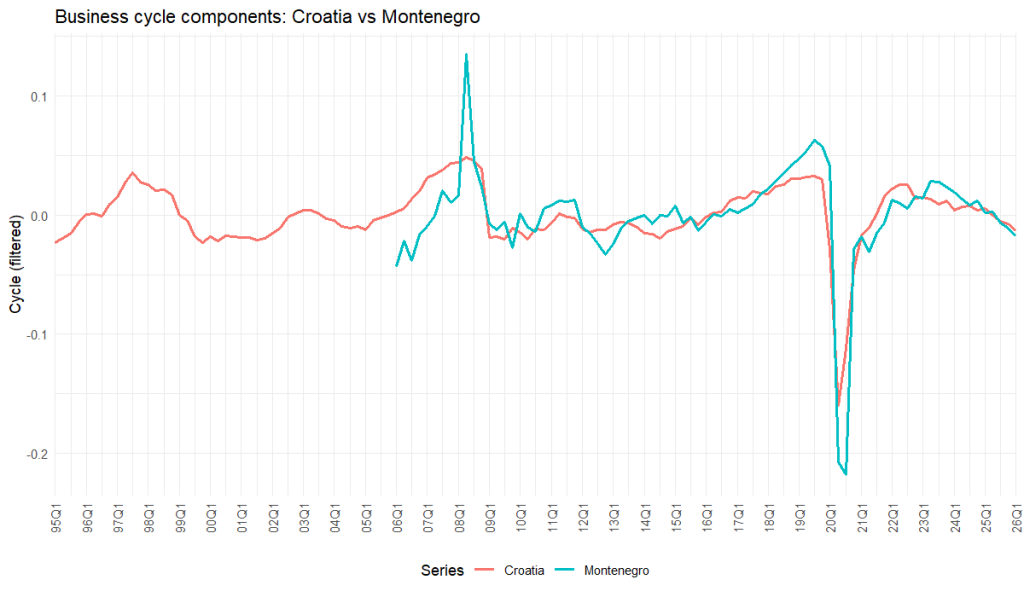
The visual evidence shows that Montenegro shares major cyclical episodes with the region, but with larger amplitude. The comparison with Bosnia and Herzegovina shows common movement around the global financial crisis, the pre-pandemic expansion, the COVID-19 collapse and the post-pandemic recovery. Montenegro’s pandemic decline is visibly deeper, reflecting the greater cyclical amplitude of its GDP. The comparison with Croatia is also strong. Both economies show a pronounced pandemic fall and rebound, and both have cycles that appear sensitive to seasonal and external-demand conditions.
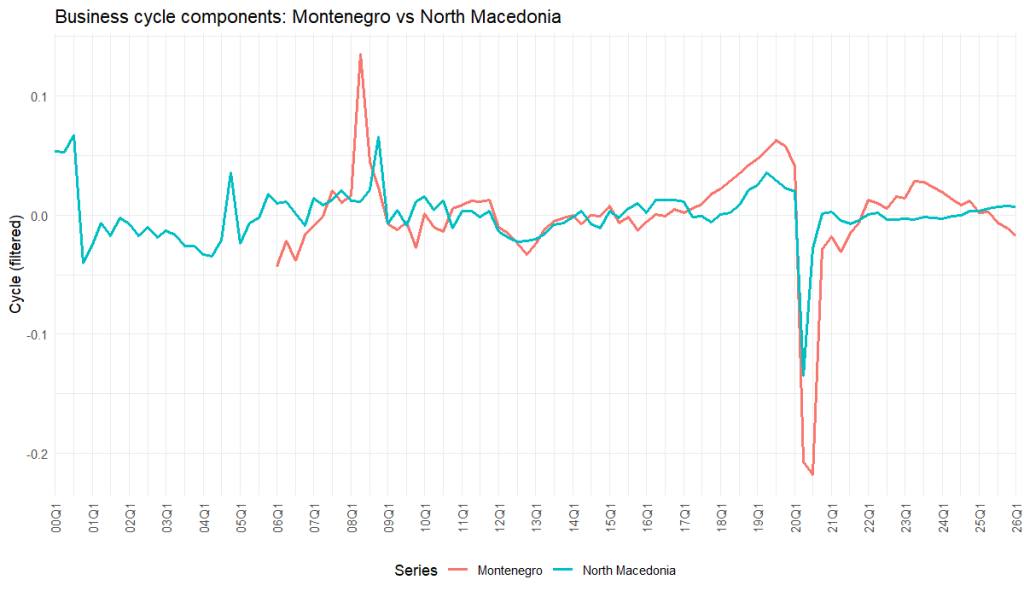
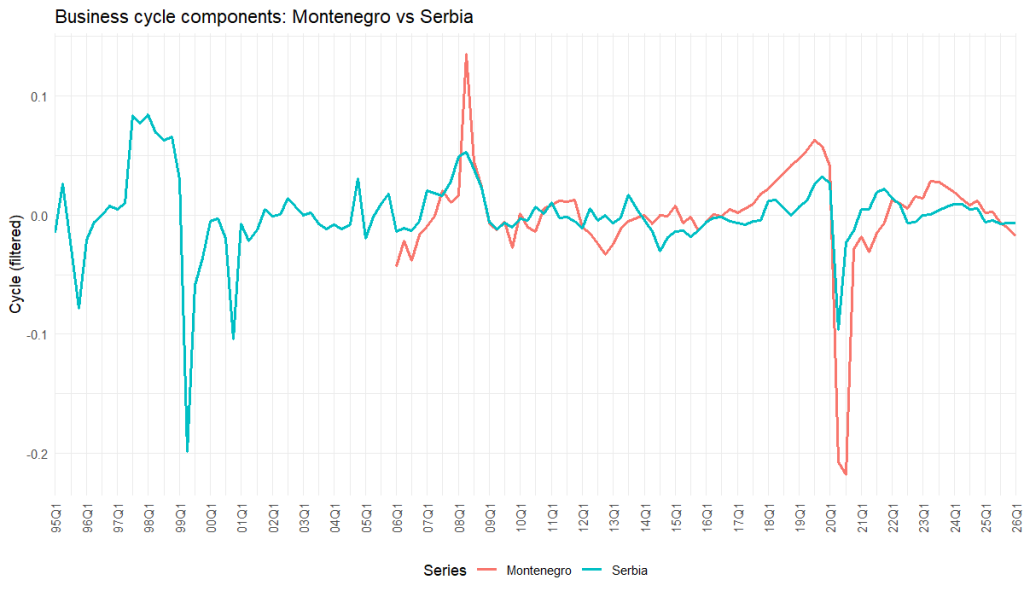

The comparison with Slovenia shows a common European pattern, although Slovenia’s cycle is smoother. The comparison with Serbia is meaningful but less tight. The major shocks are shared, especially COVID-19, but the amplitude and some timing details differ. North Macedonia is the weakest visual comparison. It shares the pandemic shock, but the broader cycle alignment is less stable than with Bosnia and Herzegovina, Croatia or Slovenia.
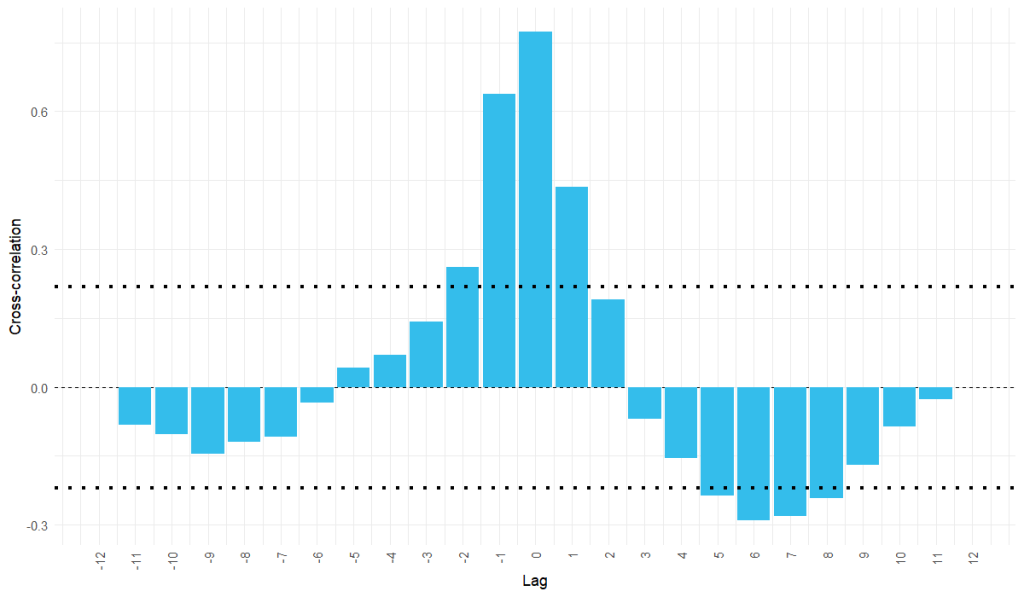
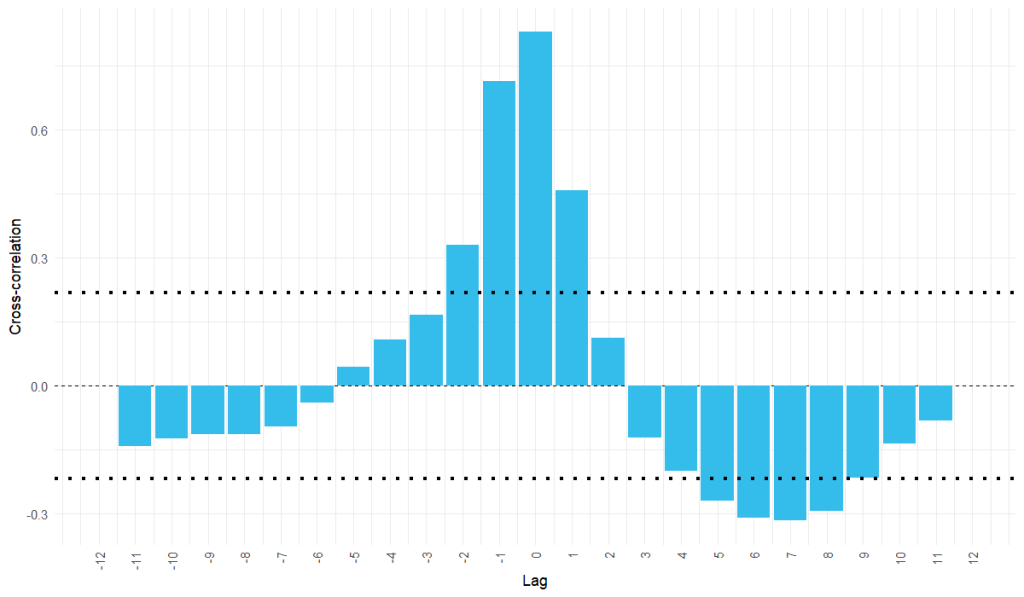
The cross-correlation results confirm the ranking. For Bosnia and Herzegovina and Montenegro, the zero-lag correlation is about 0.773, with lag -1 also high at about 0.637. Since the file order is Bosnia and Herzegovina versus Montenegro, the negative-lag shoulder suggests that Bosnia and Herzegovina may lead Montenegro slightly in some episodes, but the dominant relationship is contemporaneous. For Croatia and Montenegro, the zero-lag correlation is even stronger, about 0.829, with lag -1 around 0.714. Again, the main relationship is simultaneous, with some evidence that Croatia may lead Montenegro by one quarter in certain phases.
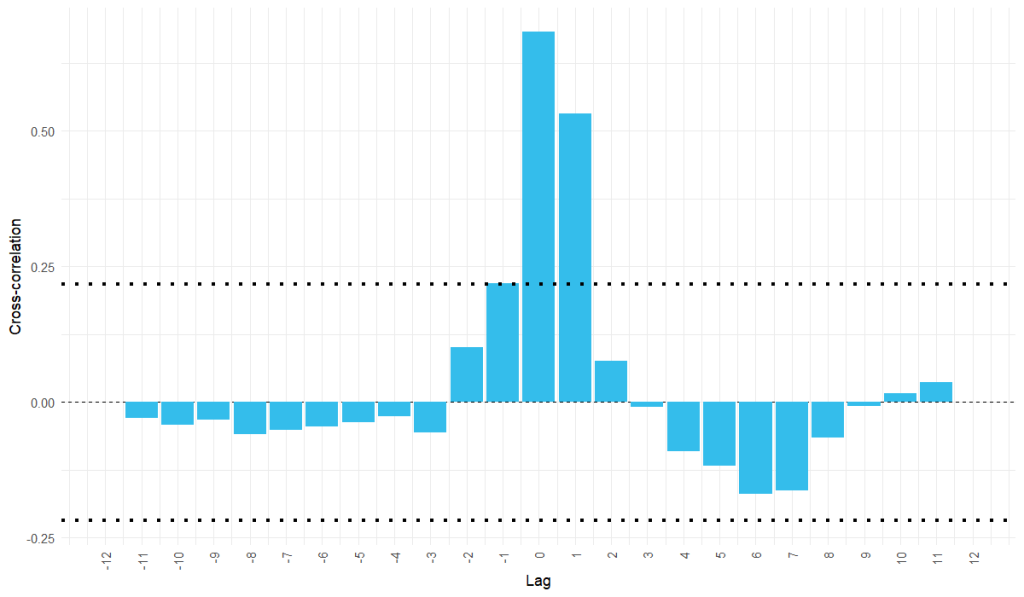
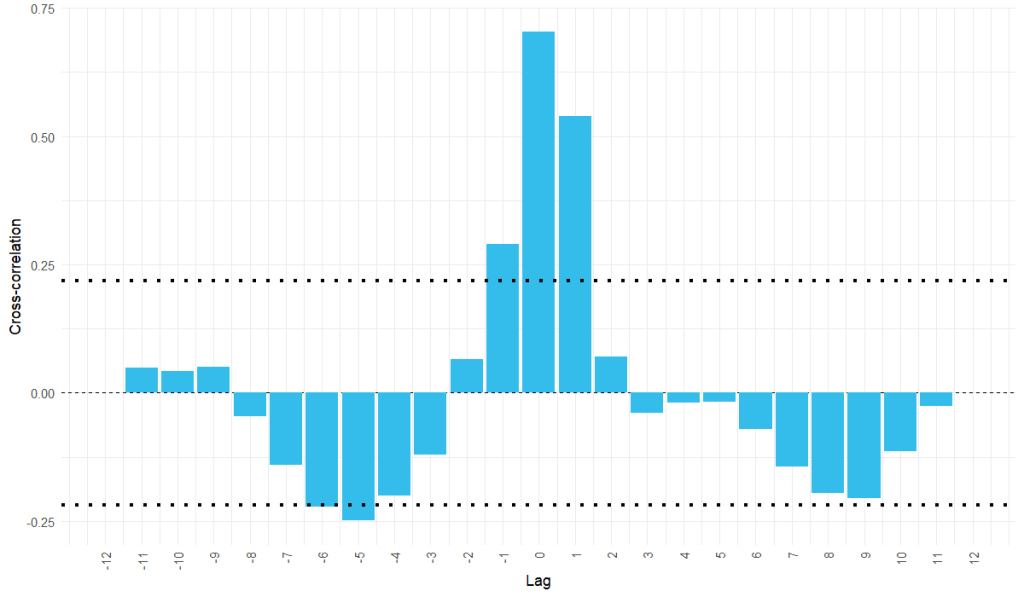

For Montenegro and North Macedonia, the zero-lag correlation is about 0.682 and lag +1 is about 0.532. Since Montenegro is listed first, this suggests a strong contemporaneous link and some possibility that North Macedonia follows or leads depending on the precise convention, but the zero-lag value is clearly dominant. For Montenegro and Serbia, the zero-lag correlation is about 0.703 and lag +1 is about 0.540. This points to meaningful regional synchronisation, again centred on the same quarter. For Slovenia and Montenegro, the highest correlation is at lag -1, about 0.674, while the zero-lag correlation is almost as high, about 0.666. Since Slovenia is listed first, this suggests that Slovenia may lead Montenegro by one quarter in some episodes, but the difference from the contemporaneous correlation is small.
Table 6. Concordance index
| Series1 | Series2 | N | N11 | N00 | Nc | C_index | p_value |
|---|---|---|---|---|---|---|---|
| Bosnia and Herzegovina | Montenegro | 80 | 35 | 30 | 65 | 0.813 | 0.000 |
| Croatia | Montenegro | 81 | 35 | 30 | 65 | 0.802 | 0.000 |
| Montenegro | North Macedonia | 81 | 28 | 20 | 48 | 0.593 | 0.119 |
| Montenegro | Serbia | 81 | 25 | 29 | 54 | 0.667 | 0.004 |
| Slovenia | Montenegro | 81 | 32 | 32 | 64 | 0.790 | 0.000 |
Table 6 gives the phase-based summary. Montenegro’s highest concordance is with Bosnia and Herzegovina, at about 0.813. Croatia follows closely, with about 0.802. Slovenia is also strongly synchronised, at about 0.790. Serbia is moderately synchronised, with a concordance index of about 0.667. North Macedonia is the weakest pair, at about 0.593, and its p-value is not statistically significant in the reported table. This hierarchy is plausible. Montenegro’s cycle is most aligned with economies that share regional and European shocks and, in the cases of Croatia and Slovenia, strong external-demand linkages. Serbia is meaningfully aligned, while North Macedonia is less consistently synchronised.
The conclusion from Part 4 is that Montenegro’s GDP cycle is highly regional but unusually volatile. It shares the timing of major shocks with neighbouring economies, especially Croatia, Bosnia and Herzegovina and Slovenia, but its own cycle often has a larger amplitude. This distinction matters: synchronisation does not mean identical economic experience. Montenegro may enter the same phase as its neighbours, but the depth of the contraction or strength of the rebound can be much larger.
Methodological appendix to Part 4
The cross-correlation function measures the relationship between two cyclical series at different leads and lags. A peak at lag zero means that the two cycles move most strongly at the same time. A peak away from zero may suggest that one economy leads or lags the other. The sign of the lag must be interpreted according to the order of the series in the calculation.
The concordance index measures how often two economies are in the same cyclical phase. Each quarter is classified as expansion or contraction for each economy. If both economies are in expansion, or both are in contraction, the quarter is concordant. The index is the share of comparable quarters in which the phases match. A value close to one indicates strong synchronisation, while a value close to one half suggests weak phase alignment. Concordance should be read together with the cycle graphs and cross-correlations, because two economies may share phases while having very different amplitudes.
Overall conclusion
Montenegro’s quarterly GDP series from 2006Q1 to 2026Q1 is strongly seasonal, trending and cyclical. The original series shows a large quarterly seasonal pulse, while the seasonally adjusted series reveals the underlying long-run rise, the pandemic collapse and the post-pandemic rebound. The ARIMA model is statistically coherent and passes residual checks, but it is not the best-performing forecast model in the holdout comparison; ETS and the seasonal naive benchmark perform better. Business-cycle dating confirms the global-financial-crisis downturn, the strong late-2010s expansion, the severe COVID-19 contraction and the recovery, but the latest cyclical position remains method-dependent. Regional synchronisation is strongest with Bosnia and Herzegovina, Croatia and Slovenia, moderate with Serbia and weakest with North Macedonia.
The broader message is that Montenegro’s GDP cycle should be interpreted as both regional and high-amplitude. It shares major shocks with other former Yugoslav economies, but its own fluctuations are sharper. For analysts, this means that Montenegro should not be treated as a small version of the regional average. It is regionally synchronised, but cyclically more exposed.
References
Baxter, M., & King, R. G. (1999). Measuring business cycles: Approximate band-pass filters for economic time series. Review of Economics and Statistics, 81(4), 575–593.
Corbae, D., & Ouliaris, S. (2006). Extracting cycles from nonstationary data. Econometric Theory, 22(4), 843–858.
Eurostat. (n.d.). Gross domestic product and main components — quarterly national accounts (namq_10_gdp).
Harding, D., & Pagan, A. (2002). Dissecting the cycle: A methodological investigation. Journal of Monetary Economics, 49(2), 365–381.
Hodrick, R. J., & Prescott, E. C. (1997). Postwar U.S. business cycles: An empirical investigation. Journal of Money, Credit and Banking, 29(1), 1–16.
Hyndman, R. J., & Athanasopoulos, G. (2025). Forecasting: Principles and Practice.
U.S. Census Bureau. (2025). X-13ARIMA-SEATS Seasonal Adjustment Program.