
Dating Croatia’s business cycle
Part 3 shifts from forecasting the GDP level to identifying Croatia’s business cycle. A business cycle is the movement of economic activity around its longer-term trend. This is not the same as asking whether GDP rises or falls in a single quarter. An economy may grow while remaining below trend, or slow down while still being above trend. For that reason, filter-based business-cycle dating gives a more nuanced view of macroeconomic phases.
This analysis compares three filters: Hodrick-Prescott, Baxter-King and Corbae-Ouliaris. Each method separates trend and cycle differently. The aim is not to claim that one filter reveals the true cycle with perfect precision. The aim is to identify which episodes are robust across methods.
The Hodrick-Prescott filter gives a full-sample view from 1995Q1 to 2026Q1. It classifies Croatia as being in expansion for 73 quarters and in contraction for 52 quarters. The early sample contains several alternating phases, but the first major macroeconomic story is the expansion from 2005Q2 to 2008Q2. The global financial crisis then produces a contraction from 2008Q3 to 2009Q3. After a brief recovery, Croatia moves through further below-trend phases in the early 2010s. A more sustained expansion appears from 2014Q4 to 2017Q3, followed by a shorter interruption and another expansion from 2018Q2 to 2019Q3. The pandemic contraction is dated from 2019Q4 to 2020Q2, followed by a strong expansion from 2020Q3 to 2022Q3. The latest part of the HP dating suggests moderation: after a short positive phase in 2024Q2–2024Q3, the series is classified as below trend from 2024Q4 to 2026Q1.


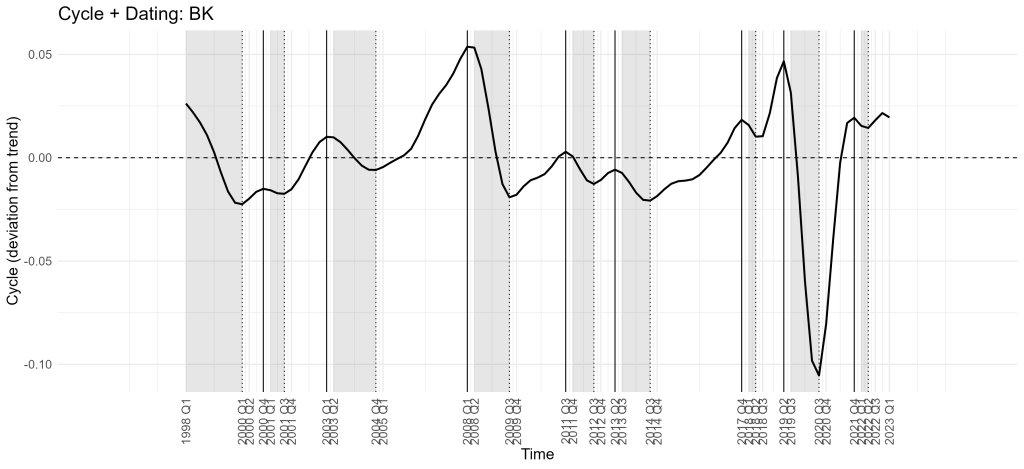
The Baxter-King filter is smoother and covers a shorter effective sample because it loses observations at both endpoints. It identifies 58 expansion quarters and 43 contraction quarters. It confirms the main pre-crisis expansion from 2005Q1 to 2008Q1, the global-financial-crisis contraction from 2008Q2 to 2009Q3, the renewed expansion around 2009Q4–2011Q3, and the later recovery from 2014Q4 to 2017Q4. It also captures the pandemic contraction from 2019Q3 to 2020Q3 and the rebound from 2020Q4 to 2021Q4. Its endpoint limitation means it is less useful for interpreting the latest years.

The Corbae-Ouliaris filter gives a full-sample classification and records 82 expansion quarters and 43 contraction quarters. It broadly agrees with the other filters on the major episodes: strong expansion before 2008, contraction during the global financial crisis, renewed growth after the mid-2010s, pandemic contraction and post-pandemic recovery. It dates the pandemic contraction from 2019Q3 to 2020Q3, followed by expansion from 2020Q4 to 2022Q4. It then identifies contraction from 2023Q1 to 2023Q3, renewed expansion from 2023Q4 to 2025Q3 and contraction again from 2025Q4 to 2026Q1.
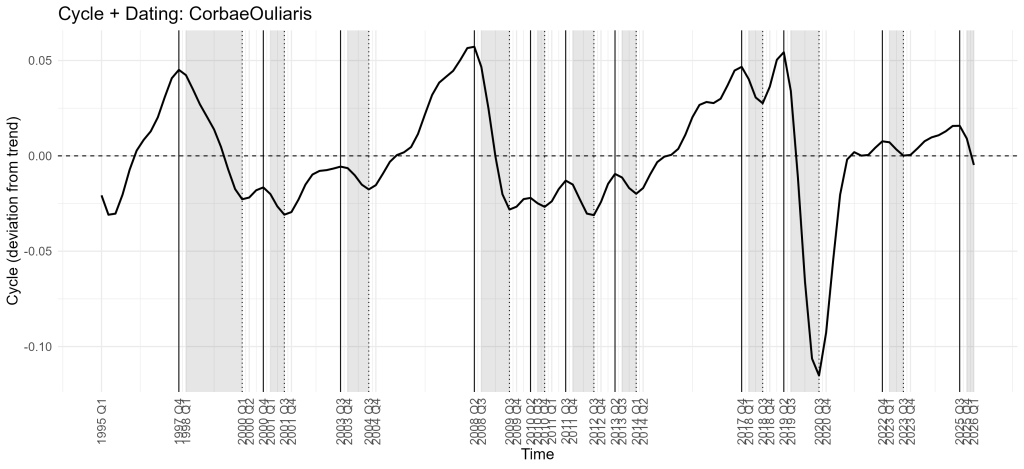
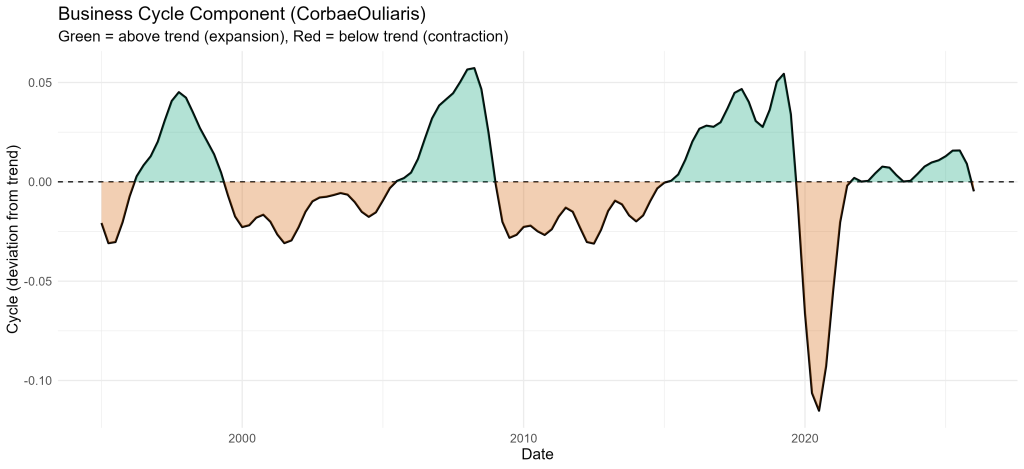
The three filters therefore agree on the most important episodes but differ in the detail. The pre-2008 expansion, the global-financial-crisis downturn, the long recovery after the early 2010s, the pandemic collapse and the post-pandemic rebound are robust. The greatest uncertainty concerns the most recent years. HP is more cautious and classifies the latest quarters as below trend, while Corbae-Ouliaris shows a longer renewed expansion before turning negative at the very end. Baxter-King cannot fully resolve this because of endpoint losses.
Table 4. Business cycles dating for Croatia time series
For a blog-style interpretation, the HP filter is the most convenient main reference because it covers the full sample and is easy to explain. However, it should not be used mechanically. The Baxter-King and Corbae-Ouliaris results are valuable robustness checks. Where all three filters agree, the cyclical signal is strong. Where they differ, especially near the end of the sample, the safer conclusion is that Croatia has moved from post-pandemic rebound into a more mature and possibly moderating phase, rather than into a clearly defined new boom.
Methodological appendix to Part 3
Business-cycle dating begins by separating GDP into a trend component and a cyclical component. If the cycle is above zero, GDP is interpreted as being above trend. If the cycle is below zero, GDP is interpreted as being below trend. These positive and negative phases are then described as expansions and contractions.
The Hodrick-Prescott filter estimates a smooth trend and treats deviations from that trend as the cycle. The Baxter-King filter is a band-pass filter designed to isolate movements at business-cycle frequencies. The Corbae-Ouliaris filter is another method for extracting cycles from non-stationary data. None of these filters observes the true cycle directly. Each imposes assumptions. Robust interpretation should therefore focus on episodes that appear across several filters, not on isolated turning points produced by one method only.
