Reading Time: 3 minutesThere are a few time series graphs we can use to identify underlying seasonal pattern. These are seasonal and seasonal subseries plots, with some variations in their appearance. A seasonal plot is similar to a time plot except that the data are plotted against the individual “seasons” in which the…


Serbian monthly retail trade time series plots
Reading Time: 2 minutesIn this blog post graphic methods are used to describe Serbian monthly retail trade time series. Two types of a line graph could be used to show changes in monthly retail trade over time. The first displays both time series on a single graph. The second type of graph displays…

Seasonality analysis of Serbian catering time series
Reading Time: 3 minutesThere are a few time series graphs we can use to identify underlying seasonal pattern. These are seasonal and seasonal subseries plots, with some variations in their appearance. A seasonal plot is similar to a time plot except that the data are plotted against the individual “seasons” in which the…

Serbian monthly catering time series plots
Reading Time: 2 minutesIn this blog post graphic methods are used to describe Serbian monthly catering time series. Two types of a line graph could be used to show changes in monthly catering over time. The first displays both time series on a single graph. The second type of graph displays each series…
Seasonality analysis of Croatia quarterly GDP time series
Reading Time: 2 minutesThere are a few time series graphs we can use to identify underlying seasonal pattern. These are seasonal and seasonal subseries plots, with some variations in their appearance. A seasonal plot is similar to a time plot except that the data are plotted against the individual “seasons” in which the…

Monthly industrial production time series plots
Reading Time: 3 minutesIn this blog post graphic methods are used to describe monthly industrial production time series in six countries. Two types of a line graph could be used to show changes in monthly industrial production over time. The first displays both original and seasonally and calendar adjusted time series for six…

Quarterly GDP time series plots
Reading Time: 3 minutesIn this blog post graphic methods are used to describe quarterly GDP time series in six countries. Two types of a line graph could be used to show changes in quarterly GDP over time. The first displays both original and seasonally and calendar adjusted time series for Croatia, Serbia and…

Seasonality analysis of Bosnia and Herzegovina quarterly GDP time series
Reading Time: 2 minutesThere are a few time series graphs we can use to identify underlying seasonal pattern. These are seasonal and seasonal subseries plots, with some variations in their appearance. A seasonal plot is similar to a time plot except that the data are plotted against the individual “seasons” in which the…

Serbian transportation time series
Reading Time: < 1 minuteThis is the first in a series of blog posts analysing and discussing Serbian quarterly transportation time series. Aims The aims of these blog posts are the following: To describe main features of quarterly transportation time series To model series using popular time series models To forecast future transportation time…
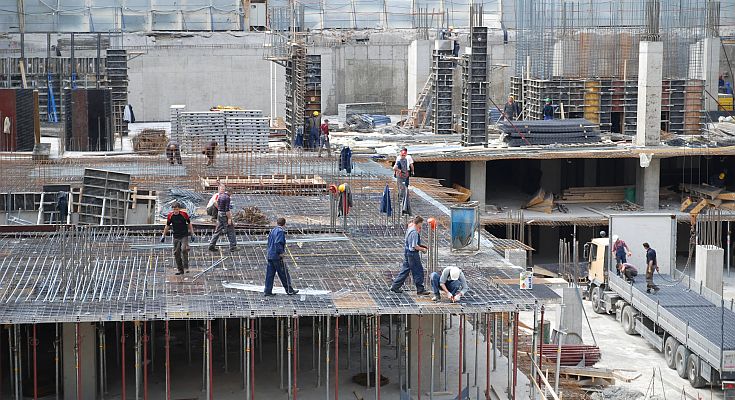
Serbian construction time series
Reading Time: < 1 minuteThis is the first in a series of blog posts analysing and discussing Serbian quarterly construction time series. Aims The aims of these blog posts are the following: To describe main features of quarterly construction time series To model series using popular time series models To forecast future construction time…