In this blog post graphic methods are used to describe Serbian monthly retail trade time series.
Two types of a line graph could be used to show changes in monthly retail trade over time. The first displays both time series on a single graph. The second type of graph displays each series on a separate panel. On such graph any persistent pattern related to trend or seasonal factors should be clearly visible.
Figure 1 shows line graphs of monthly retail trade time series on the same panel.

As we expected retail trade series in current prices shows persistent upward trend with a break during 2008 and slower growth after 2008. However, retail trade series in constant prices after persistent upward trend before 2008 shows significant drop in the level and until 2015 variation around a constant level, then started to increase after 2015.
Figure 2 shows line graphs of monthly retail trade time series on the separate panels.
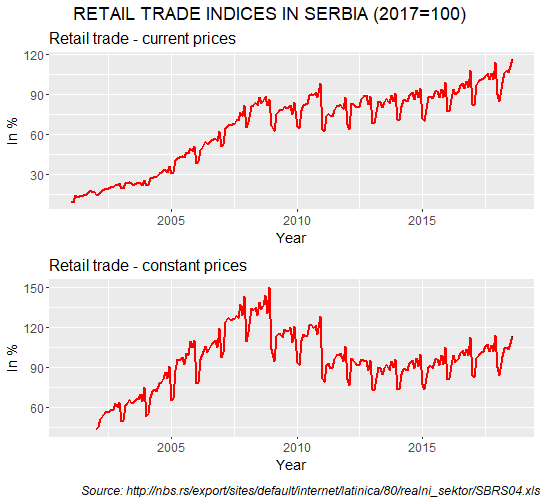
On the graphs in Figure 2 the differences or similarities in seasonal patterns between retail trade series in constant and current prices are not quite clearly visible until 2013. However, we may spot the similarities in seasonal patterns in these two series after 2013. The seasonal patterns and differences between two series will be further examined on the seasonal plots.