

Synchronisation of Bosnia and Herzegovina’s GDP cycle with other former Yugoslav economies
Part 4 compares Bosnia and Herzegovina’s GDP cycle with the cycles of Croatia, Montenegro, North Macedonia, Serbia and Slovenia. Synchronisation matters because economies that move together may share trade exposure, labour-market links, financial channels, remittance flows, tourism shocks, EU demand conditions or regional spillovers. The analysis uses HP-filtered cycles, cross-correlation functions and the concordance index. Table 5 is used for the lead-lag interpretation, but it is not inserted as a displayed blog table.
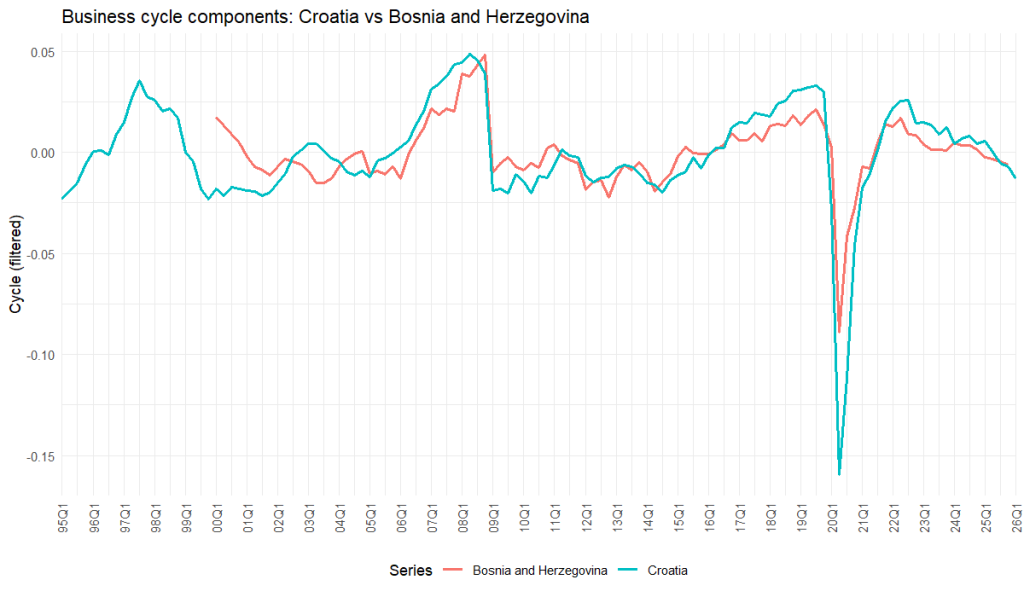
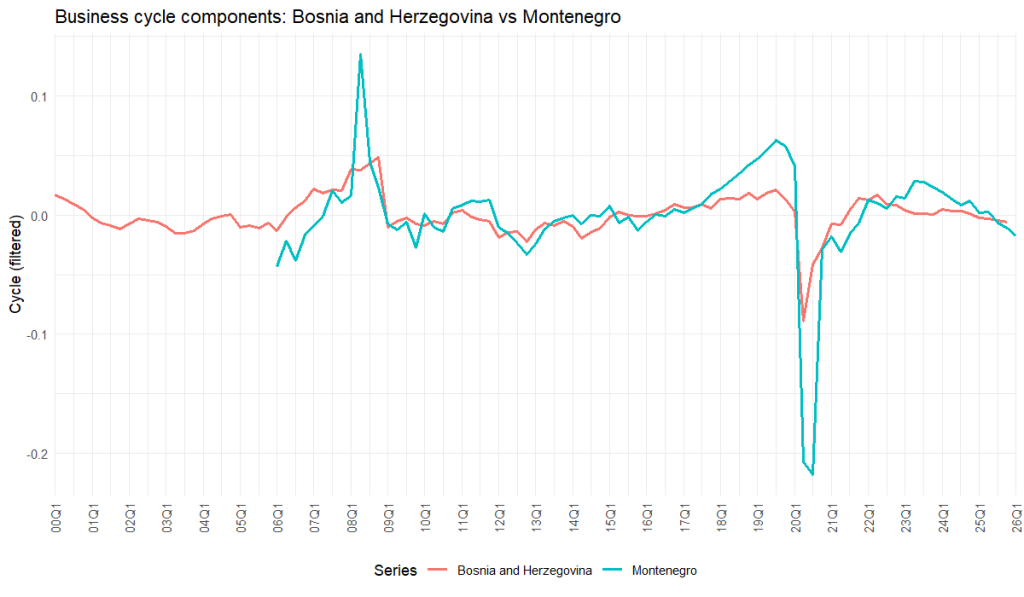
The visual evidence shows strong regional synchronisation, especially with Croatia, Montenegro and Slovenia. Bosnia and Herzegovina and Croatia share the same broad sequence of phases: pre-crisis expansion, global-financial-crisis downturn, gradual recovery, pandemic contraction and post-pandemic rebound. Croatia’s pandemic fall is visibly deeper, but the timing is closely aligned. Bosnia and Herzegovina and Montenegro also move together around the main turning points, although Montenegro’s cycle is more volatile, especially during the pandemic. This is consistent with Montenegro’s smaller size and greater sensitivity to tourism-related shocks.
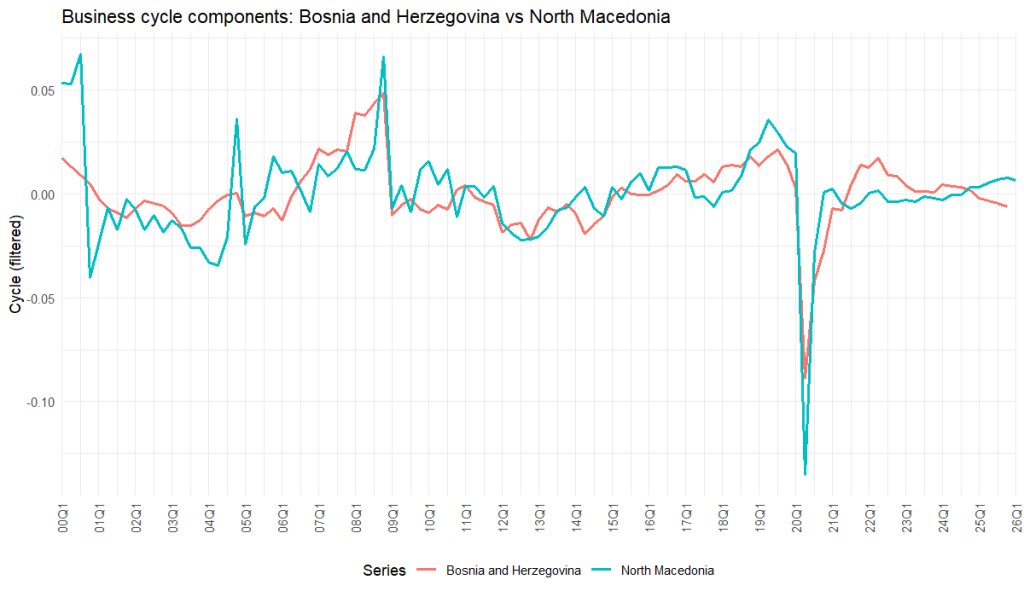
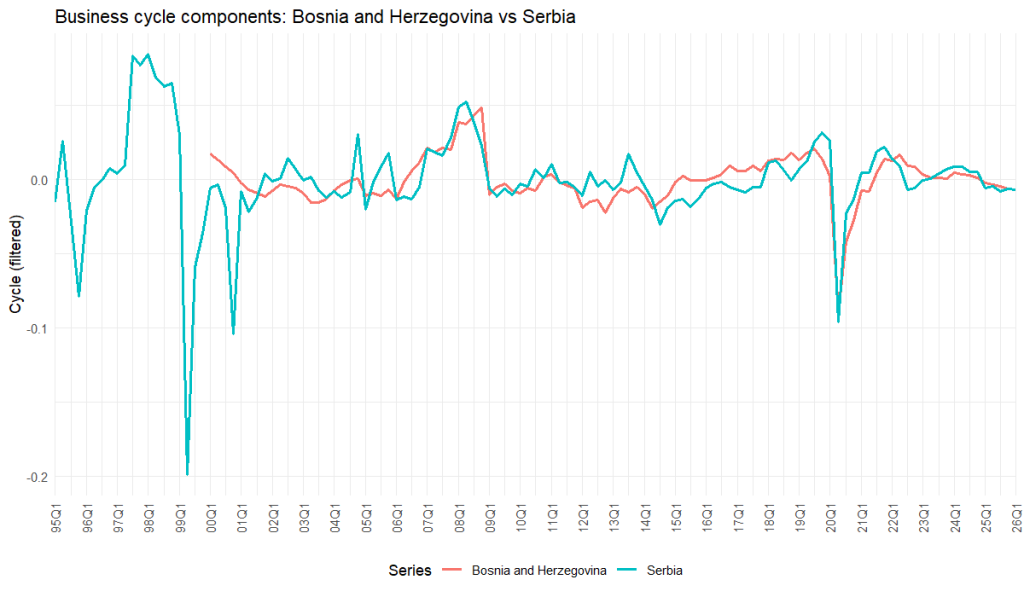
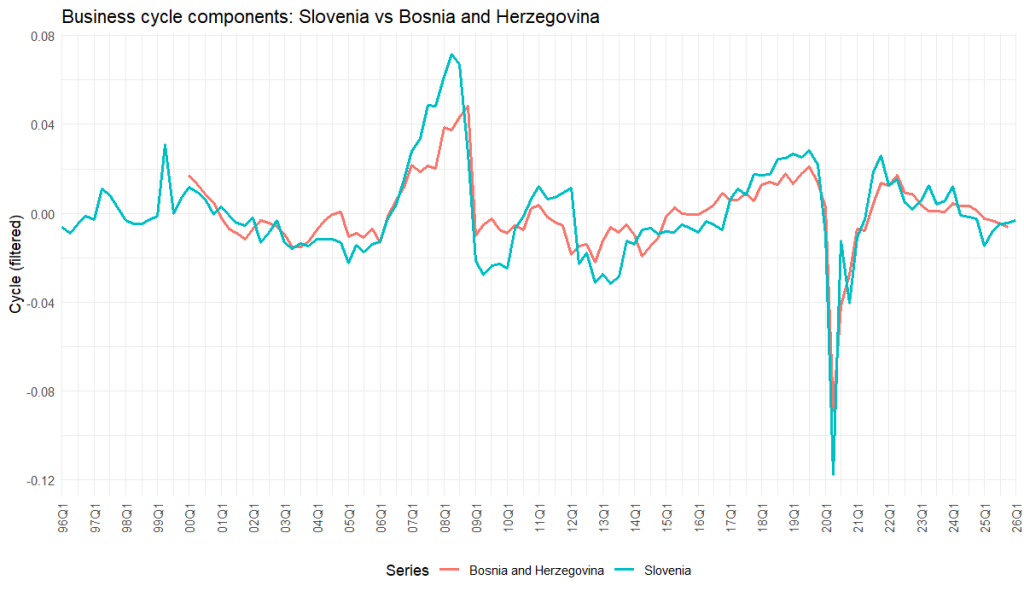
The comparison with Slovenia is also strong. Slovenia’s cycle is smoother in some phases, but the broad pattern is closely aligned, particularly around the global financial crisis and the pandemic. The comparison with Serbia shows clear common shocks and broadly similar timing, though the correlation is not as strong as with Croatia or Slovenia. North Macedonia is the weakest visual case. Some shared movements are visible, especially around COVID-19, but the alignment is less stable across the whole sample.
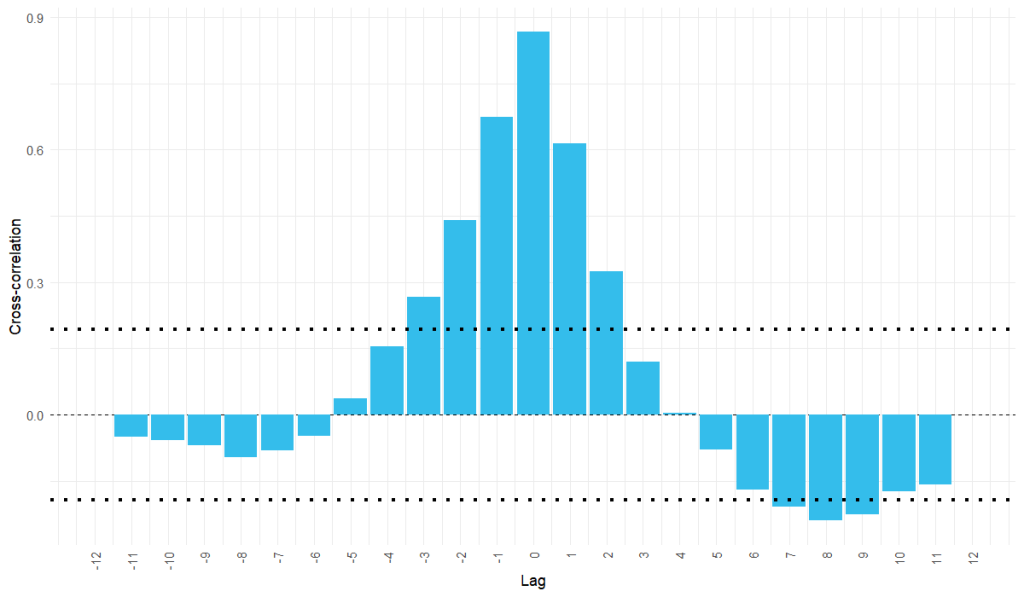
The cross-correlation results confirm that the strongest relationship is contemporaneous. For Croatia and Bosnia and Herzegovina, the cross-correlation peaks at lag zero, around 0.866. The adjacent lag of -1 is also high, around 0.674, and lag +1 is around 0.614. Since the file order is Croatia versus Bosnia and Herzegovina, the small asymmetry suggests that Croatia may lead Bosnia and Herzegovina slightly in some episodes, but the dominant result is simultaneous co-movement.
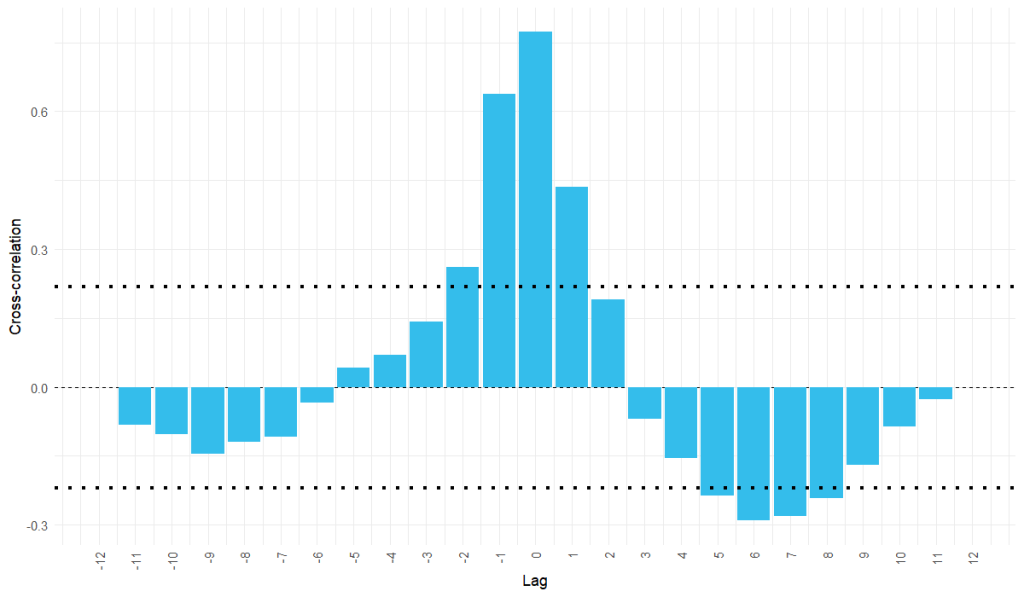
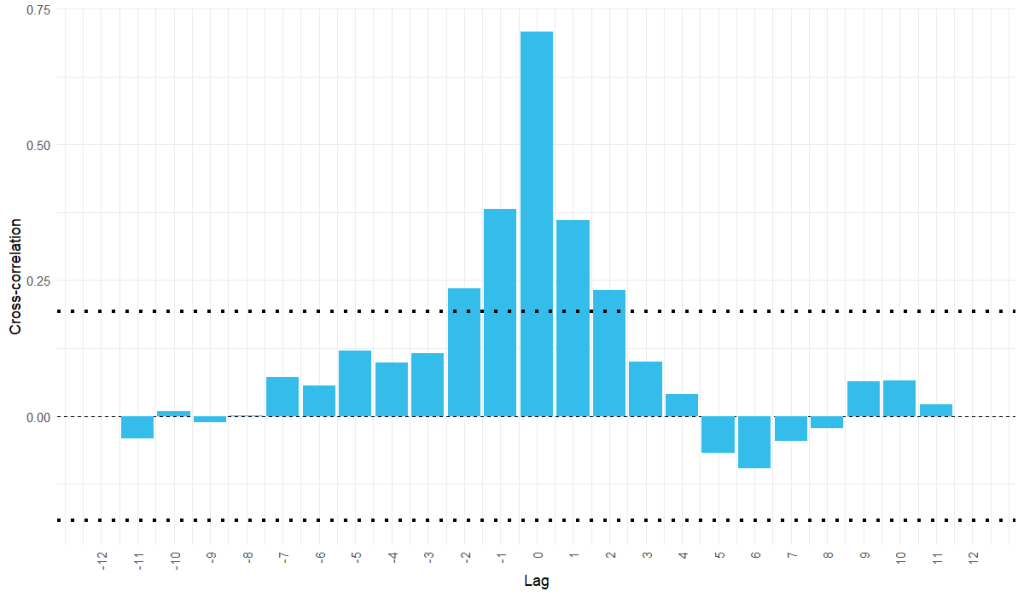
For Bosnia and Herzegovina and Montenegro, the zero-lag correlation is around 0.773. The lag -1 correlation is also strong, around 0.637, while lag +1 is around 0.436. With Bosnia and Herzegovina listed first in the file name, this suggests a possible one-quarter lead of Bosnia and Herzegovina over Montenegro in some movements, but again the contemporaneous relationship is strongest. For North Macedonia, the zero-lag correlation is around 0.707, with weaker neighbouring lags. This points to shared shocks but a less stable lead-lag structure.
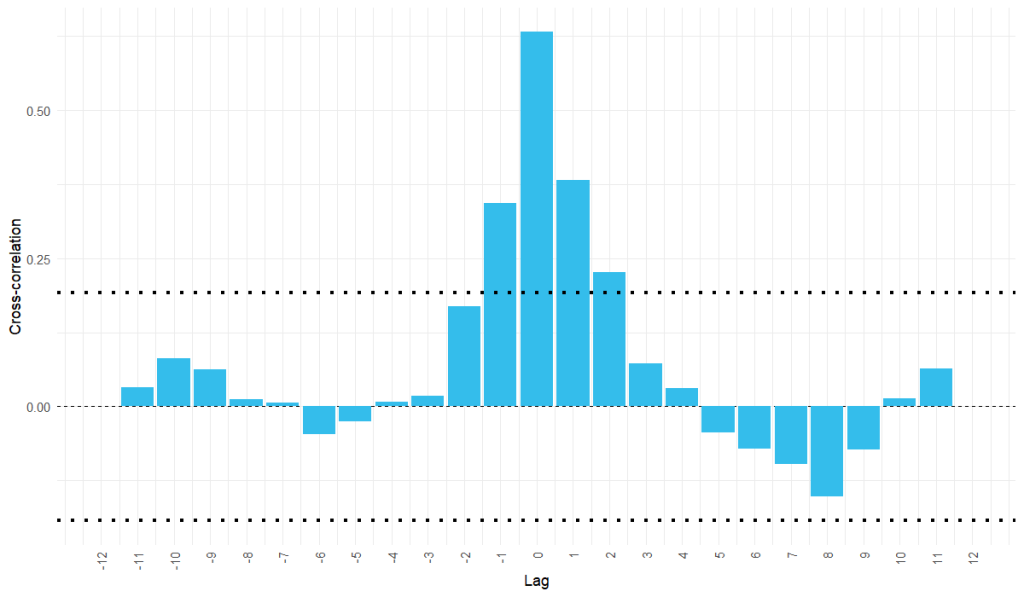
For Bosnia and Herzegovina and Serbia, the zero-lag correlation is around 0.632. The one-quarter positive lag is about 0.383 and the one-quarter negative lag about 0.343. This indicates a meaningful contemporaneous link, but weaker than the links with Croatia, Montenegro and Slovenia. For Slovenia and Bosnia and Herzegovina, the zero-lag correlation is the highest among these pairs, around 0.879. The lag -1 value is also high, around 0.714, and lag -2 is around 0.518. Since Slovenia is listed first in the file name, this suggests that Slovenia may slightly lead Bosnia and Herzegovina in some phases, but the main relationship remains contemporaneous.
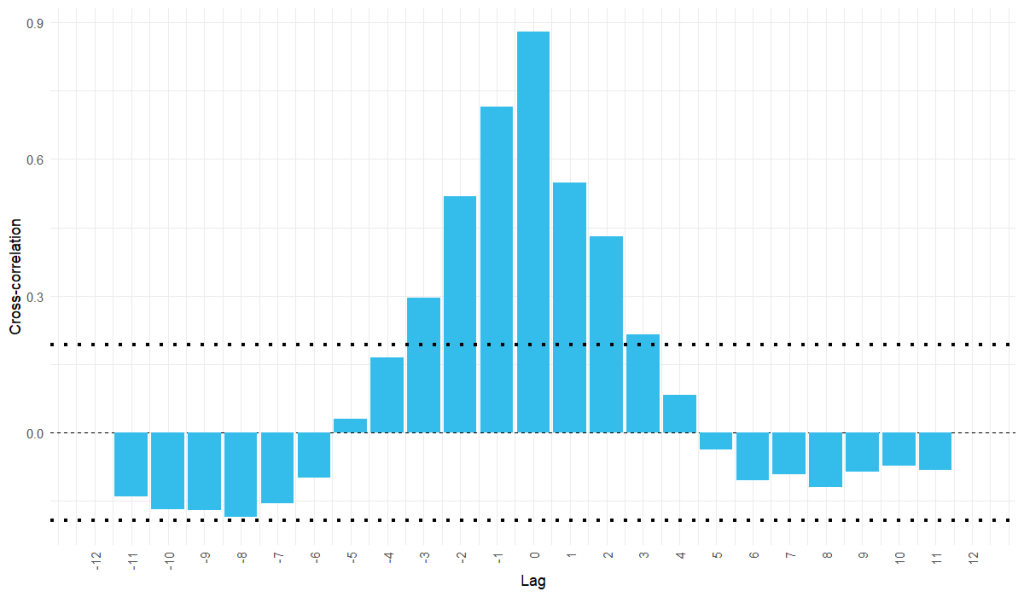
Table 6. Concordance index
| Series1 | Series2 | N | N11 | N00 | Nc | C_index | p_value |
|---|---|---|---|---|---|---|---|
| Croatia | Bosnia and Herzegovina | 104 | 39 | 47 | 86 | 0.827 | 0.000 |
| Slovenia | Bosnia and Herzegovina | 104 | 38 | 51 | 89 | 0.856 | 0.000 |
| Bosnia and Herzegovina | Montenegro | 80 | 35 | 30 | 65 | 0.813 | 0.000 |
| Bosnia and Herzegovina | North Macedonia | 104 | 30 | 35 | 65 | 0.625 | 0.014 |
| Bosnia and Herzegovina | Serbia | 104 | 30 | 43 | 73 | 0.702 | 0.000 |
Table 6 gives the phase-based summary. Bosnia and Herzegovina’s highest concordance is with Slovenia, at about 0.856. Croatia follows closely, at about 0.827. Montenegro is also high, at about 0.813. Serbia is moderately strong, at about 0.702. North Macedonia is the weakest, at about 0.625, although still statistically significant in the reported table. The concordance hierarchy is therefore clear: Bosnia and Herzegovina is most synchronised with Slovenia, Croatia and Montenegro; meaningfully synchronised with Serbia; and least synchronised with North Macedonia.
The conclusion from Part 4 is that Bosnia and Herzegovina’s GDP cycle is strongly regional. The country does not move in isolation. Its major cyclical episodes are shared with other former Yugoslav economies, particularly those most exposed to common European and regional shocks. The lead-lag evidence is secondary to the main finding: the most important relationships occur at or near the same quarter.
Methodological appendix to Part 4
The cross-correlation function measures the relationship between two cyclical series at different leads and lags. A peak at lag zero means that the two cycles move most strongly at the same time. A peak away from zero may indicate that one economy leads or lags the other. The sign of the lag must be interpreted according to the order of the series in the calculation.
The concordance index measures how often two economies are in the same cyclical phase. Each quarter is classified as expansion or contraction for each economy. If both economies are in expansion or both are in contraction, the quarter is concordant. The index is the share of comparable quarters in which the phases match. A value close to one indicates strong synchronisation, while a value close to one half suggests weak phase alignment.
Overall conclusion
Bosnia and Herzegovina’s quarterly GDP series from 2000Q1 to 2025Q4 is strongly trending, highly seasonal and persistent. The series shows long-run recovery and expansion, interrupted by the global financial crisis and the COVID-19 shock. The ARIMA model performs well as a short-term forecasting tool, with all actual holdout observations falling inside both the 80% and 95% forecast intervals. Business-cycle dating confirms the main episodes across three filters: pre-crisis expansion, crisis contraction, post-crisis adjustment, pandemic decline and recovery. Regional synchronisation is strongest with Slovenia, Croatia and Montenegro, meaningful with Serbia and weakest with North Macedonia. The broader message is that Bosnia and Herzegovina’s GDP cycle should be interpreted both nationally and regionally. Domestic conditions matter, but the major cyclical movements are deeply connected with the wider former Yugoslav and European macroeconomic environment.