
Okun, made in Ljubljana: A policy reading of Slovenia’s growth–jobs link – Part III
1. One country, one “law,” fewer excuses
Taken at face value, Slovenia looks like an economy where Okun’s Law should be unusually easy to verify. The report leans into that intuition: a small open economy that moved from socialism to a market framework, experienced EU and euro adoption, and endured repeated macro shocks, yet still produced a dataset long enough to test whether the growth–unemployment relationship is a dependable regularity rather than a fair-weather friendship.
Parts I and II showed why that expectation is simultaneously reasonable and dangerous. Reasonable, because the visuals line up with the basic Okun idea first set out by Arthur Okun: when output weakens, unemployment tends to rise; when output strengthens, unemployment tends to fall. Dangerous, because the period includes breaks large enough to bend even well-behaved macro relationships, and because annual data forces each observation to carry more interpretive weight than it probably wants.
The report’s final synthesis is therefore not “Okun is true.” It is more useful than that: Okun’s Law in Slovenia is strongest when you treat it as a relationship between slack and slack (gaps), and when you explicitly account for rare but regime-shifting shocks. When you ignore those shocks, or insist on reading everything through raw annual growth, Okun’s signal becomes faint, and causality becomes hard to see.
2. What the combined evidence actually says about Okun in Slovenia
The cleanest way to summarise the report’s evidence is to follow the logic of what it estimates and why.
Start with the pictures. As shown in Figure 1 the level series move as you would expect through major episodes, but the report stresses the asymmetry: unemployment rises sharply in downturns and falls more gradually in recoveries.
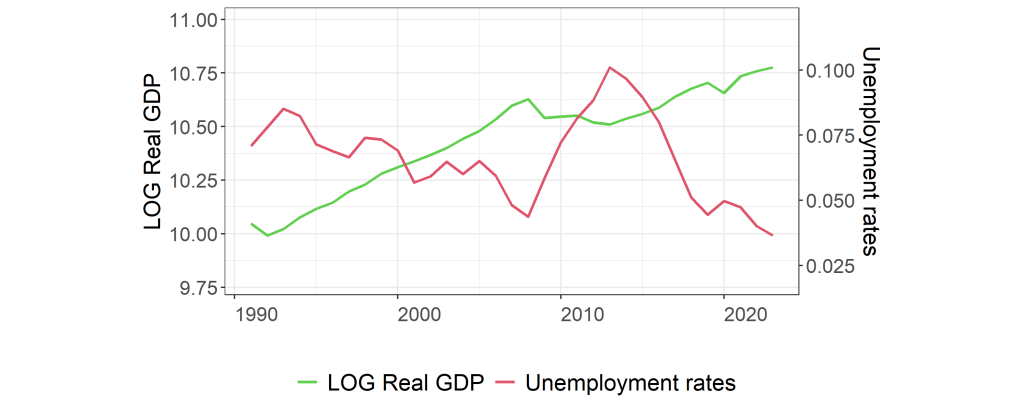
That asymmetry matters because it hints at a labour market that amplifies shocks on the way down and drags its feet on the way up. A policymaker who treats “growth is back” as “jobs will follow automatically” is, in the report’s telling, taking an unnecessary gamble.
Then come the foundations. The report’s stationarity results divide the world into two objects. The level series (log GDP per capita and the unemployment rate) behave like series with trend or persistent drift, while their first differences behave like “well-behaved” stationary series. The output and unemployment gaps, constructed with the Robert Hodrick–Edward Prescott filter, are stationary, as cyclical deviations are designed to be. Robert Hodrick and Edward Prescott are not invoked as a philosophical position; they are invoked as a practical way to measure slack consistently over time (Hodrick & Prescott, 1997).
That sets up the report’s key interpretive choice: the gap model is the policy model. It maps “how far output is from potential” to “how far unemployment is from its natural rate”, a language stabilisation policy already speaks.
The cointegration evidence then reinforces this framing. In levels, the report finds limited support for a stable long-run equilibrium over the full sample using the Engle–Granger approach (Engle & Granger, 1987). But once it allows the long-run relationship itself to shift, using Allan Gregory and Bruce Hansen’s break-aware test—the evidence strengthens notably in the first-difference and gap settings (Gregory & Hansen, 1996). T, e system approach (Johansen, 1991) becomes more persuasive when the report includes crisis dummies, which is another way of saying: the long-run relationship is easier to identify if you separate ordinary dynamics from extraordinary years. And the combined-test logic in Bayer–Hanck points in the same direction: the gap relationship is the most consistently supported, while levels are fragile and specification-sensitive (Bayer & Hanck, 2013).
Then come the models that turn “existence” into “meaning”: ARDL and NARDL. The report treats ARDL as a pragmatic workhorse for small samples and mixed integration, and it explicitly grounds the long-run inference in the bounds-testing framework associated with M. Hashem Pesaran, Yongcheol Shin, and Richard Smith (Pesaran, Shin, & Smith, 2001). That matters because it makes the conclusion less dependent on any single cointegration test.
The report’s two headline ARDL results are plain enough to translate into policy language without losing their meaning:
- In the first-difference ARDL (unemployment rate on GDP dynamics, with crisis dummies), the error-correction term is −0.223, implying a gradual return to equilibrium, roughly a fifth of disequilibrium corrected per year, and a negative, statistically significant Okun relationship in both short and long run.
- In the gap ARDL (unemployment gap on output gap), the long-run effect is −0.227, and the error-correction term is −0.796, implying very rapid adjustment, most disequilibrium corrected within a year.
Those two numbers tell a coherent story. In annual data, a gap model can behave like a stabilisation mechanism: output slack closes, and labour slack follows relatively quickly. The difference model also supports Okun, but it delivers a more gradual, noisier adjustment story.
Finally, the report tests whether the relationship is meaningfully asymmetric. Using the nonlinear ARDL framework associated with Shin, Yu and Greenwood-Nimmo (2014), it finds little evidence that expansions and contractions have radically different long-run effects in Slovenia. That does not mean asymmetry never exists; it means this dataset does not insist on it. In policy terms, that is oddly comforting: it suggests the average cyclical mapping may be informative, rather than being dominated by one-sided labour-market pathologies.
3. Where policy transmission looks strongest, and where it leaks
If you want one “policy takeaway” from the report’s econometric sequence, it is this: the output gap is the best predictor of labour-market slack when the big shocks are treated as big shocks, not as ordinary data points.
The causality results make that explicit. Without structural dummies, the report finds no statistically significant Granger-type predictability in either direction across levels, differences, or gaps. In plain English: if you pretend the sample is one continuous regime, neither variable consistently “leads” the other.
Add the 2009 and 2020 dummies and the picture changes. In levels, the evidence becomes borderline bidirectional at the 10% level; in first differences, it remains weak. But in the gap model with dummies, the report finds a clear unidirectional relationship: output-gap deviations help predict unemployment-gap deviations, while the reverse does not. That is exactly the kind of directional result a stabilisation policymaker wants: the cyclical state of the economy leads cyclical labour slack, not the other way around.
This is also where the report’s scepticism becomes useful. It does not claim Slovenia is immune to labour-market feedback into output. It instead argues that, given annual data and limited observations, detecting subtle feedback is hard, while detecting the macro channel from output slack to unemployment slack becomes feasible once the biggest discontinuities are accounted for. The “leak” in transmission is therefore not necessarily that the mechanism fails; it is that measurement and regime shifts can mask it.
The report also rejects one tempting complication: piecewise regression. It checks for breaks in regression coefficients using the multiple-break logic associated with Jushan Bai and Pierre Perron, and also the sequential multiple-break approach of Ditzen, Karavias and Westerlund, and concludes that statistically significant breakpoints are not identified within the regression frameworks it tests (Bai & Perron, 1998; Ditzen, Karavias, & Westerlund, 2024). That is an important negative result: it suggests that the relationship can be treated as broadly stable in slope once major shocks are handled via dummies, without needing to chop the sample into multiple regimes and lose even more degrees of freedom.
In human terms, Slovenia’s Okun relationship “leaks” less than one might fear. The leak is mostly in the analyst’s toolbox: if you model slack as growth, ignore trend and breaks, and expect year-to-year causality to announce itself, you will conclude the mechanism is weak. If you model slack as slack and respect discontinuities, you see a much clearer transmission channel.
4. EU-member context, carefully and briefly
The report repeatedly situates Slovenia’s story in institutional and integration terms: it frames Slovenia as an economy that transitioned early, integrated into European structures, and experienced reforms and demographic shifts that could affect labour-market adjustment. That context does not “prove” Okun’s Law, but it helps interpret why a relatively stable cyclical mapping might emerge. A labour market operating within a mature policy framework, where stabilisation tools, automatic responses, and institutional norms are more predictable, can make cyclical relationships easier to detect, even in a small open economy. The report’s caution remains: large global shocks still matter enough to require explicit controls, even in an EU-member setting.
5. Practical takeaways
The report’s conclusions are unusually direct about what its results imply. Distilled into policy language, the key results are these:
- Slack-based thinking is the safest guide. The gap model produces the most consistent evidence of a stable long-run relationship and the clearest causal direction once extraordinary shocks are controlled.
- Adjustment can be fast, if you measure the right thing. The gap ARDL’s rapid error-correction estimate (−0.796) implies that cyclical labour slack can close quickly as output slack closes, at least in the average dynamics of this sample.
- Crisis years must be treated as special. Models that include 2009 and 2020 dummies generally perform better diagnostically and reveal clearer causal structure.
- Asymmetry is not the headline in Slovenia. The nonlinear specification does not uncover meaningful long-run asymmetry; the linear gap relationship does much of the explanatory work on its own (Shin, Yu, & Greenwood-Nimmo, 2014).
6. What to watch next
If you read the report as a guide to “what can go wrong” in applied macro, the watchlist is short but pointed.
- Don’t overlearn from annual data. The report itself flags limited observations and power as a persistent constraint; stability should be treated as encouraging, not conclusive.
- Treat the gap measures as tools, not truths. HP-filtered gaps are practical proxies for unobservable potential output and natural unemployment, not revealed quantities (Hodrick & Prescott, 1997).
- Keep structural disruption on the dashboard. The report’s own evidence shows that once large shocks are controlled, causal direction becomes clearer. Ignoring them risks mistaking “masked” relationships for absent ones.
To put it bluntly in Economist fashion: Slovenia’s Okun relationship does not need poetry; it needs housekeeping. When the analyst tidies up trend, slack, and shock-years, the “law” behaves. When those are left messy, it sulks.
References
Bai, J., & Perron, P. (1998). Estimating and testing linear models with multiple structural changes. Econometrica, 66(1), 47–78. DOI: https://doi.org/10.2307/2998540
Bayer, C., & Hanck, C. (2013). Combining non-cointegration tests. Journal of Time Series Analysis, 34(1), 83–95. DOI: https://doi.org/10.1111/j.1467-9892.2012.00814.x
Clemente, J., Montañés, A.,& Reyes, M. (1998). Testing for a unit root in variables with a double change in the mean. Economics Letters, 59(2), 175–182. DOI: https://doi.org/10.1016/S0165-1765(98)00052-4
Engle, R. F., & Granger, C. W. J. (1987). Co-integration and error correction: Representation, estimation, and testing. Econometrica, 55(2), 251–276. DOI: https://doi.org/10.2307/1913236
Gregory, A. W., & Hansen, B. E. (1996). Residual-based tests for cointegration in models with regime shifts. Journal of Econometrics, 70(1), 99–126. DOI: https://doi.org/10.1016/0304-4076(69)41685-7
Hodrick, R. J., & Prescott, E. C. (1997). Postwar U.S. business cycles: An empirical investigation. Journal of Money, Credit, and Banking, 29(1), 1–16. DOI: https://doi.org/10.2307/2953682
Johansen, S. (1991). Estimation and hypothesis testing of cointegration vectors in Gaussian vector autoregressive models. Econometrica, 59(6), 1551–1580. DOI: https://doi.org/10.2307/2938278
Okun, A. M. (1962). Potential GNP: Its measurement and significance. American Statistical Association, Proceedings of the Business and Economic Statistics Section, 98–104.
Pesaran, M. H., Shin, Y., & Smith, R. J. (2001). Bounds testing approaches to the analysis of level relationships. Journal of Applied Econometrics, 16(3), 289–326. DOI: https://doi.org/10.1002/jae.616
Shin, Y., Yu, B., & Greenwood-Nimmo, M. (2014). Modelling asymmetric cointegration and dynamic multipliers in a nonlinear ARDL framework. In Festschrift in Honor of Peter Schmidt (pp. 281–314). Springer. DOI: https://doi.org/10.1007/978-1-4899-8008-3_9
Zivot, E., & Andrews, D. W. K. (1992). Further evidence on the great crash, the oil-price shock, and the unit-root hypothesis. Journal of Business & Economic Statistics, 10(3), 251–270. DOI: https://doi.org/10.1080/07350015.1992.10509904